Illustrate Pricing Decisions with Spiral Diagram
Product Description
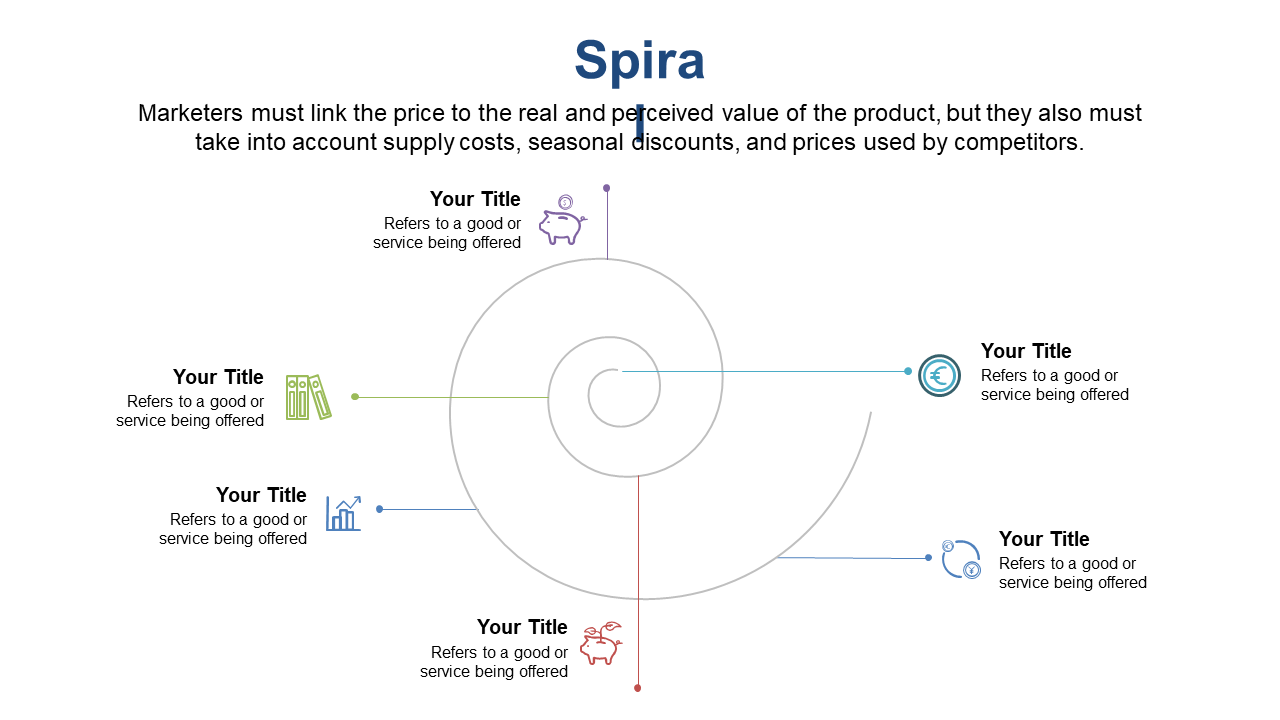
Understanding pricing decisions can often feel overwhelming, especially when multiple factors come into play. This spiral diagram provides a clear visualization of how perceived pricing connects with actual strategies, helping you craft a more persuasive narrative.
Marketers, business analysts, and product strategists will find this slide invaluable during meetings focused on pricing discussions, product launches, or strategy workshops. It’s designed to help stakeholders easily digest the information and foster collaborative dialogue.
Purchase this slide for just $0.99, and you’ll have immediate access to it. Editing is straightforward in both PowerPoint and Google Slides, so you can quickly adapt it to fit your presentation.
$0.99 – Purchase Checkout
Added to cart







