Customize Pricing Insights with Spiral Diagram
Product Description
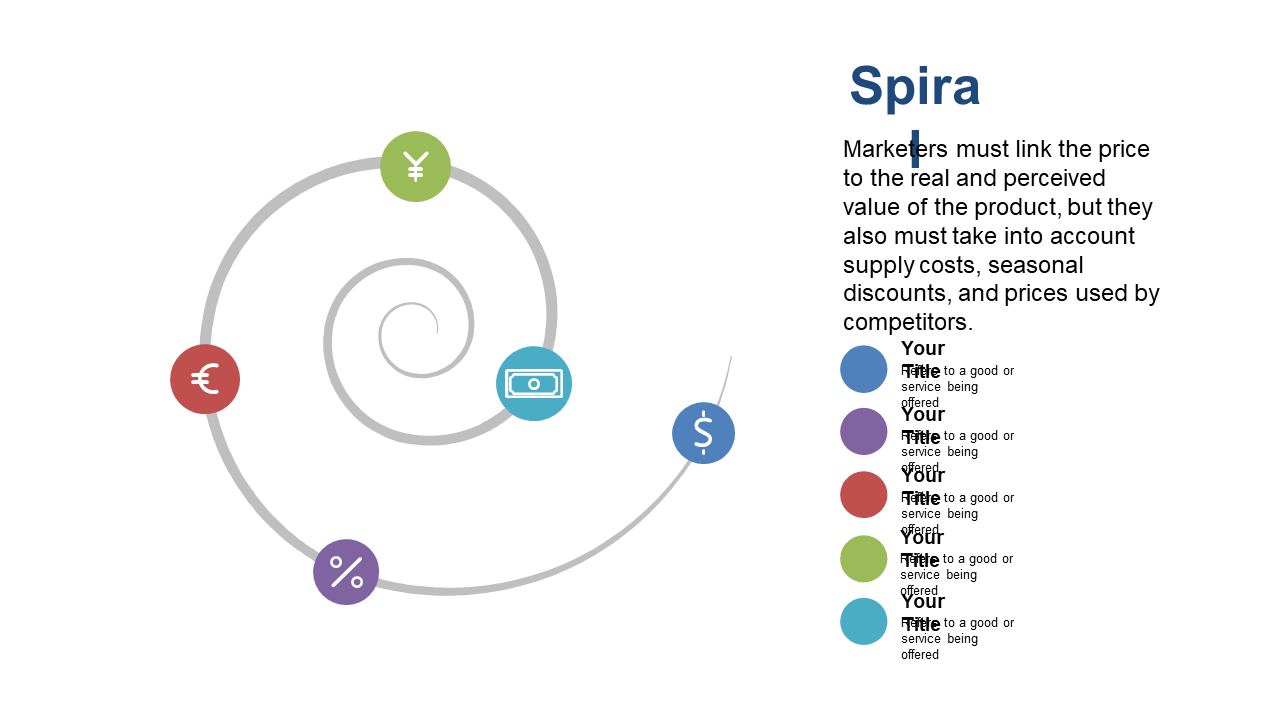
In a competitive market, communicating pricing strategies effectively is crucial, yet many find it hard to convey complex information simply. The Spiral Diagram slide captures the intricate relationship between pricing and perceived value, making your insights accessible at a glance.
This slide is perfect for pricing analysts, product marketers, or business consultants presenting in board meetings, client consultations, or strategy workshops. It’s designed to help you articulate financial ideas clearly, no matter your industry.
For just $0.99, this slide is ready for instant download and easy editing in PowerPoint or Google Slides. Start enhancing the way you present your pricing insights today.
$0.99 – Purchase Checkout
Added to cart
✅ Instant delivery
✅ Fully editable
✅ PowerPoint & Google Slides
Category:
$0.99
Per slide · No minimum · Pay only for what you pick
✓ $0.99/slide
No minimum order
✓ Mix any category
No subscription
Building a full deck?
Mix slides from any of our 58 categories —
all merged into one PowerPoint.
$0.99/slide, no minimum.
Browse All Slides →







