Communicate Pricing and Value with Spiral Diagram
Product Description
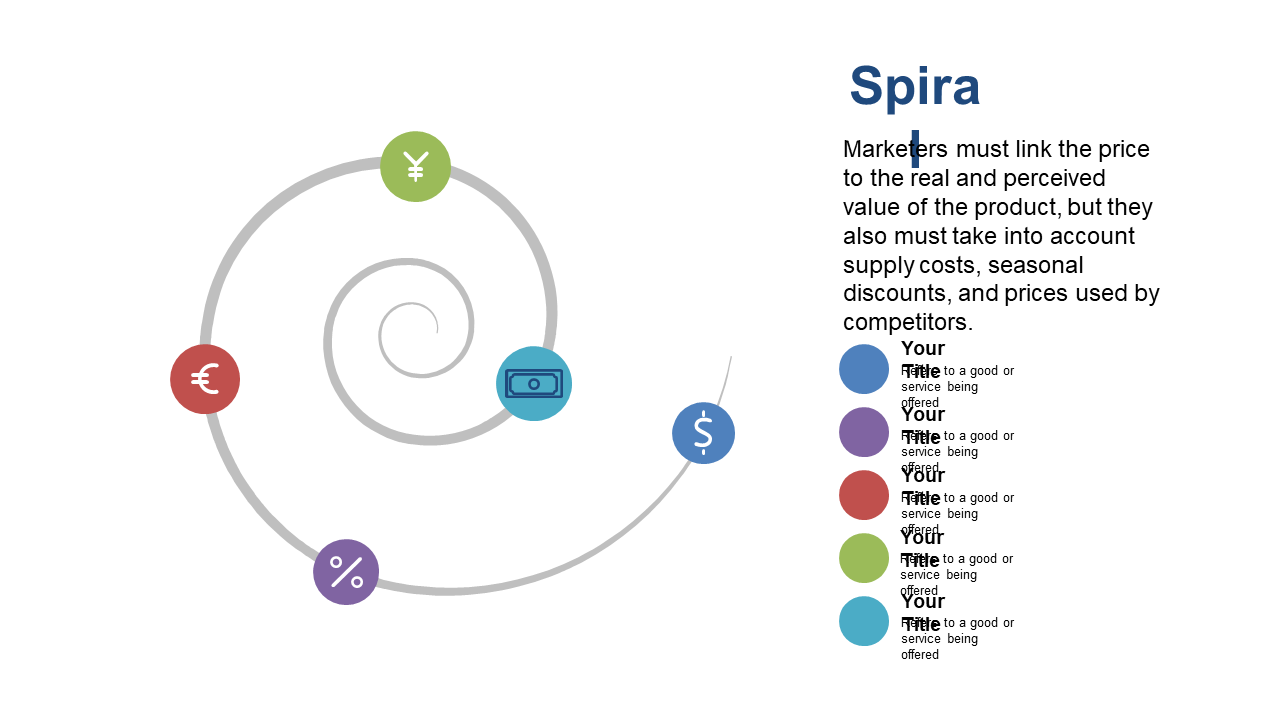
When discussing pricing strategies, clarity is key, yet many professionals struggle to articulate these concepts effectively. The Spiral Diagram slide transforms complex pricing relationships into a visually striking format that makes it easier for your audience to follow along.
Ideal for sales teams, marketing directors, and financial analysts during pricing review meetings or strategy sessions, this slide ensures that your message about pricing and value is clear and impactful. No matter your industry, it helps you engage with your audience better.
For only $0.99, you can download this slide immediately, and it’s fully editable in PowerPoint and Google Slides. Take your presentations to the next level in just minutes.
$0.99 – Purchase Checkout
Added to cart







