Engage with Social Media Metrics Comparison Slide
Product Description
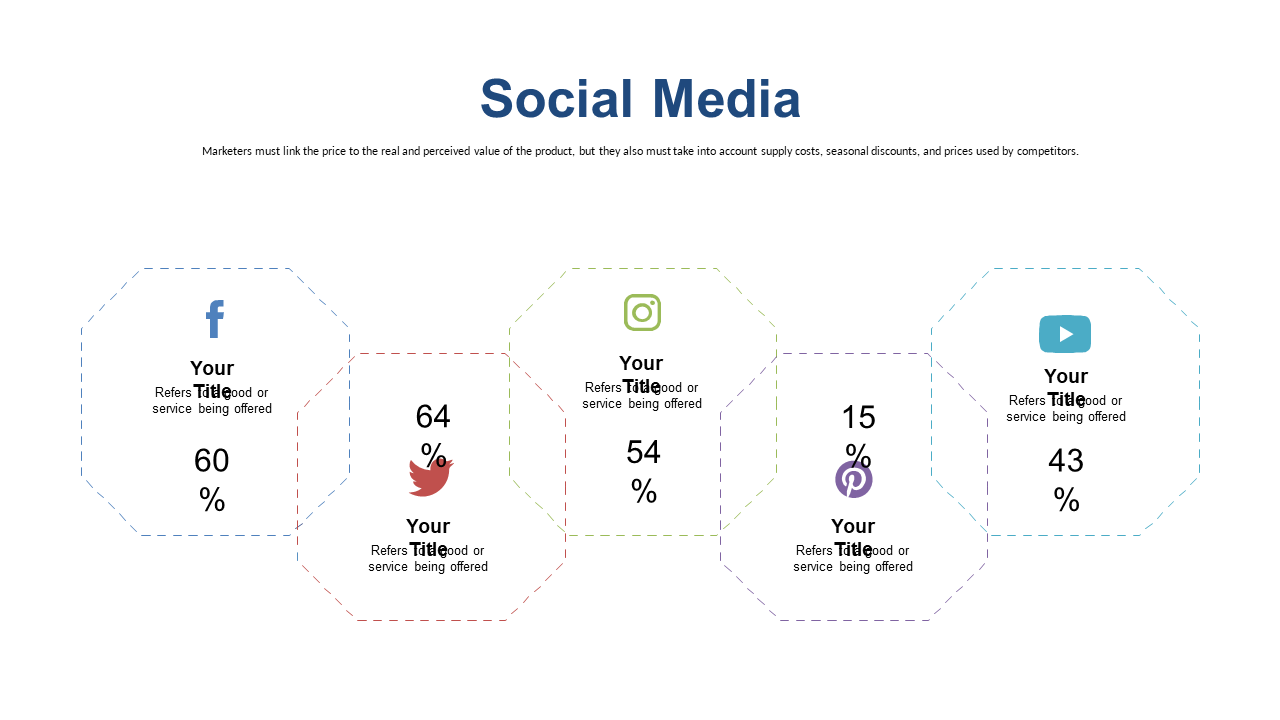
In today’s marketing environment, effectively showcasing social media metrics can greatly impact your strategy’s success. This slide provides a visually compelling way to compare engagement metrics across popular platforms, allowing for quick insights and decision-making.
Social media strategists, marketing directors, and brand analysts will benefit from using this slide during team meetings, client updates, or strategic planning sessions. It can help identify trends and insights that inform your overall marketing approach.
For only $0.99, this slide is available for instant download and is easy to edit in both PowerPoint and Google Slides. Customize it in just a few minutes to fit your presentation needs.
$0.99 – Purchase Checkout
Added to cart







