Showcase Social Media Metrics with a Dashboard
Product Description
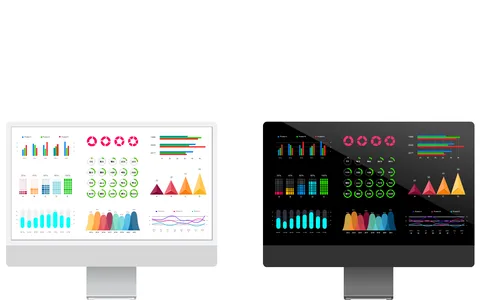
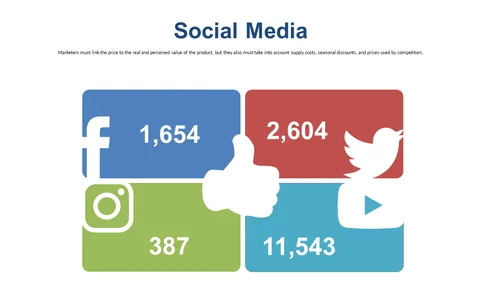
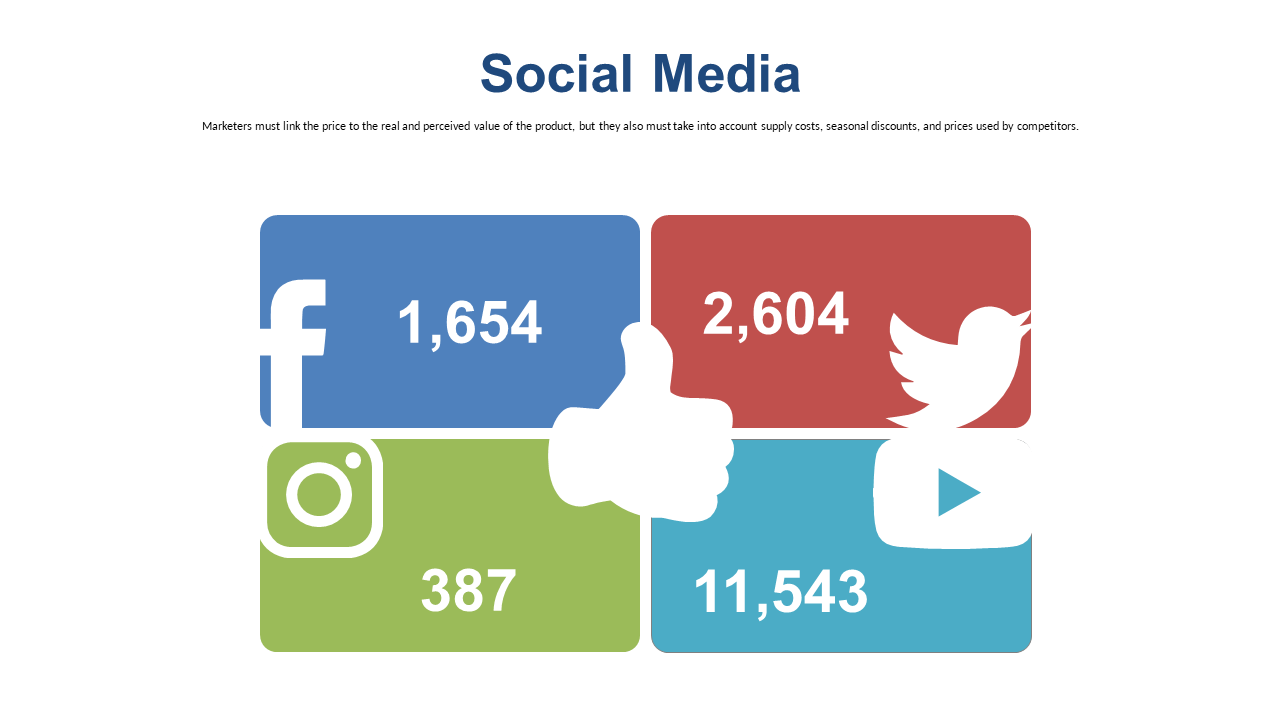
Presenting social media metrics often feels like juggling too many balls at once, especially when you need to make a compelling case quickly. The dashboard design on this slide makes it easy to condense vital insights into a visually engaging format that can captivate your audience. No more drowning in data; this layout brings clarity to your social media performance.
This slide is perfect for digital marketers, social media managers, and brand strategists who need to present metrics during quarterly reviews or client meetings. Imagine standing in front of your team or clients, confidently showcasing your social media performance with data that’s easy to digest.
Whether you’re in a brainstorming session or preparing for a pitch, this dashboard will help you communicate effectively. For only $0.99, you get a meticulously designed slide that can be downloaded instantly and edited in both PowerPoint and Google Slides. Customize it easily to fit your brand’s colors and data, making your presentation not just informative but also visually appealing.
$0.99 – Purchase Checkout
Added to cart