Cyber Security Dashboard for Metrics Presentation

Product Description
In an era where cyber security threats are rampant, presenting security metrics clearly is more important than ever. Many professionals struggle to distill complex information into digestible visuals, often resulting in confusion.
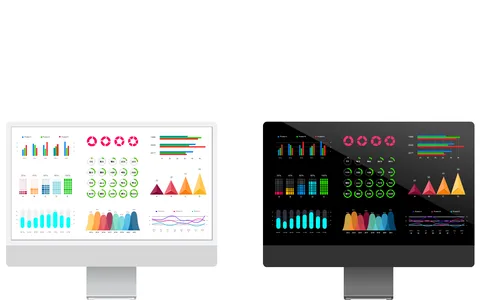
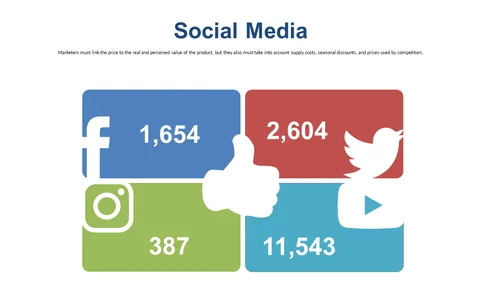
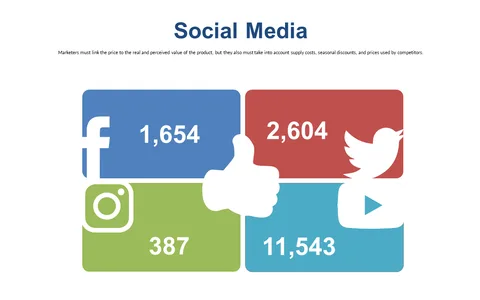
This dashboard slide provides an engaging format to showcase key metrics, helping you communicate vital data effectively. Ideal for security analysts presenting quarterly reports or IT managers updating executives on the state of network security, this slide fits perfectly into board meetings or team briefings. Cybersecurity consultants can also use it to demonstrate the effectiveness of their strategies in client proposals.
For only $0.99, you can download this slide immediately and make it part of your next presentation. It’s easy to edit in PowerPoint and Google Slides, so you can tailor the metrics to your audience’s needs quickly.
$0.99 – Purchase Checkout
Added to cart