Visualize Your Sales Process with Descriptive Labels

Product Description
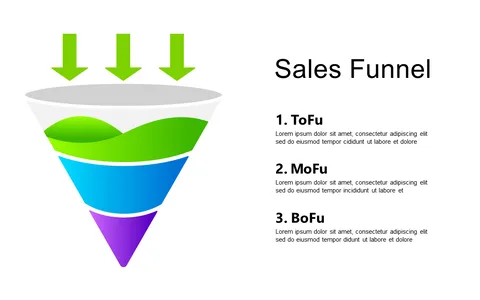
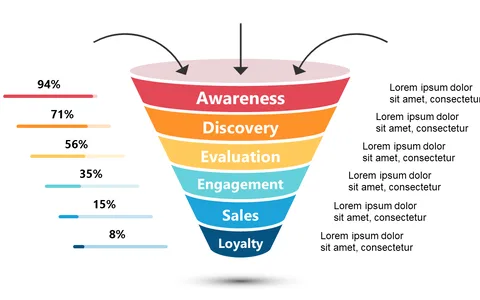
Communicating the nuances of a sales process often involves juggling multiple components that can overwhelm your audience. Without a clear visual, the significance of each stage can get lost in translation. This slide offers a funnel design that clarifies the sales process with color-coded sections and descriptive labels, making sure each part is easily understood.
It’s perfect for sales executives during quarterly reviews or marketing teams when analyzing conversion rates. Whether you’re in the tech sector, finance, or any field where sales processes are crucial, this slide helps you convey important information effectively in presentations or training sessions.
At just $0.99, this slide is available for immediate download and is fully editable in both PowerPoint and Google Slides.
You can customize it in no time, ensuring it meets your specific presentation needs.
$0.99 – Purchase Checkout
Added to cart