Showcase Your Sales Process with Color-Coded Stages

Product Description
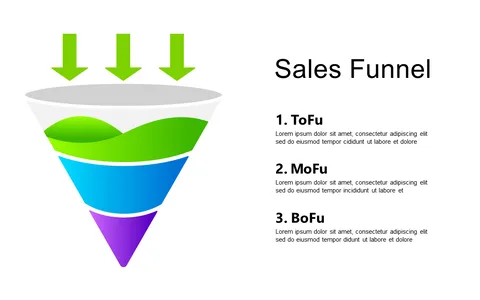
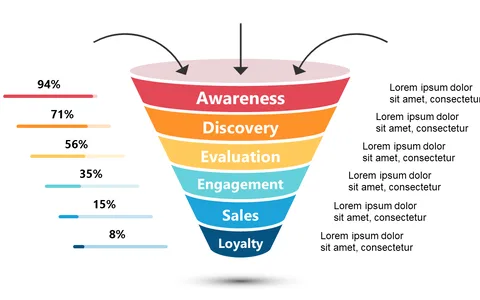
Communicating the different stages of a sales process can often leave team members confused or overwhelmed. This slide breaks down the sales journey into a clear, color-coded funnel diagram that simplifies complex information and keeps everyone on the same page.
Use this slide in meetings with sales teams, training sessions for new hires, or client discussions to illustrate your sales process effectively. Sales representatives, team leaders, and business development professionals will find it particularly useful when demonstrating their sales approach to stakeholders or clients.
Available for just $0.99, this slide is ready for immediate download and is fully editable in both PowerPoint and Google Slides. You’ll have the flexibility to modify it quickly, ensuring your presentation looks polished and professional in minutes.
$0.99 – Purchase Checkout
Added to cart