Illustrate Sales Stages with Color-Coded Funnel V2

Product Description
Presenting your sales stages clearly can be a tough challenge, often leading to confusion in team discussions. When you need to communicate complex information succinctly, having the right visual tools is crucial.
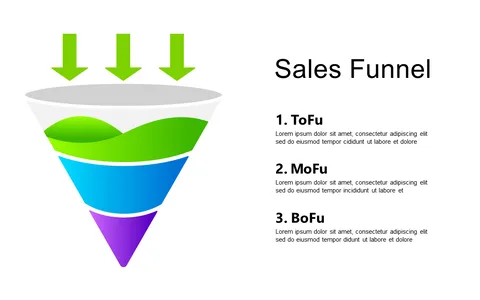
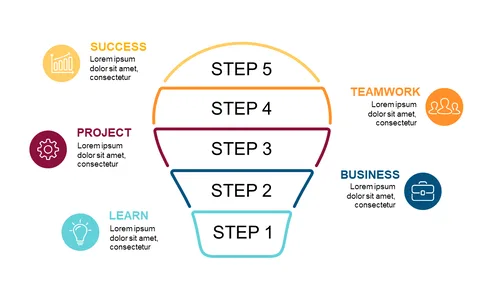
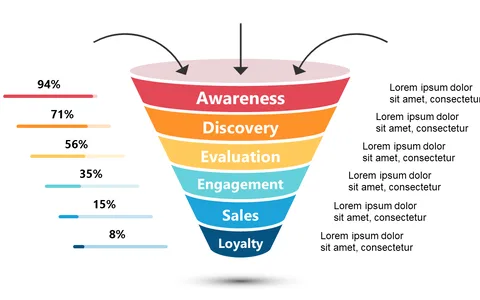
This slide features a funnel-shaped structure comprised of color-coded circles, offering a straightforward way to illustrate each stage in the sales process. You’ll find this slide particularly useful as a sales manager during weekly team meetings or coaching sessions, where you need to ensure everyone is aligned in understanding the sales approach. It’s also ideal for sales presentations where conveying process clarity is vital to achieving buy-in from executives or clients.
For just $0.99, you can access this slide right away and make quick edits in PowerPoint or Google Slides. Get it now and transform how you present your sales stages, making your meetings more effective and engaging.
$0.99 – Purchase Checkout
Added to cart