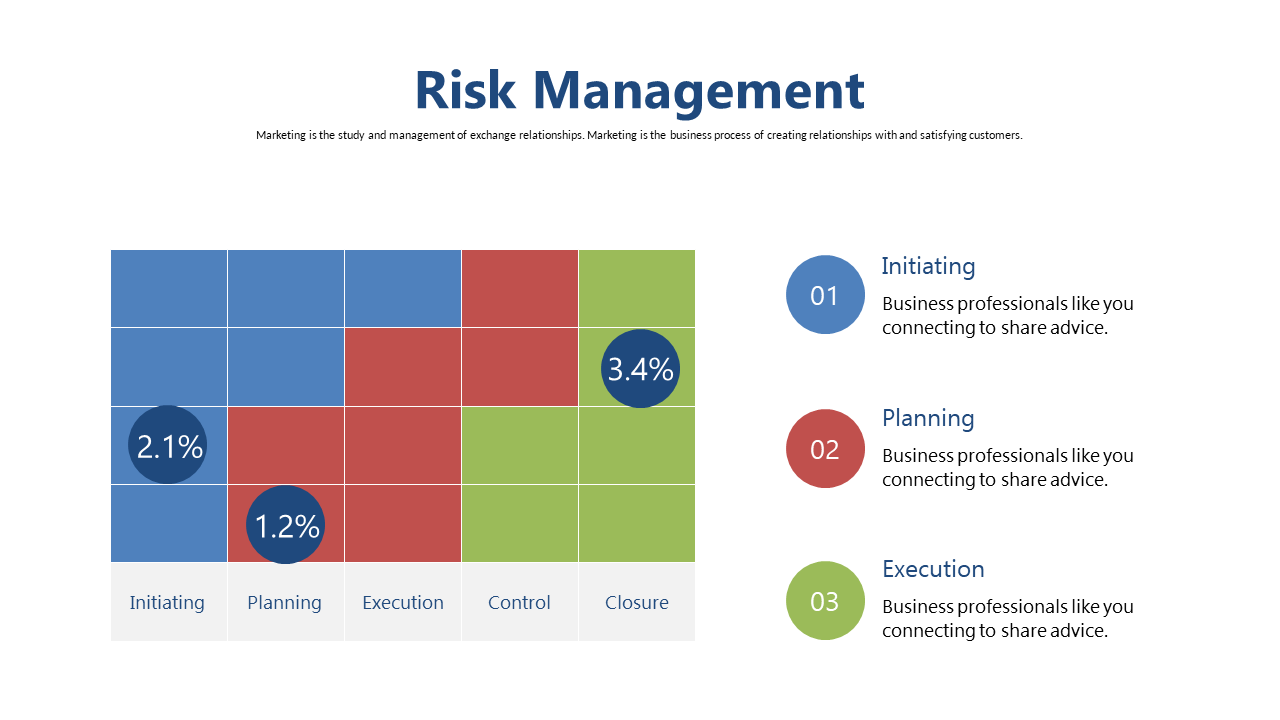
Risk Management Matrix with Phases and Percentages
Product Description
Presenting project risks clearly can be a challenge, especially when you need to make decisions quickly. Many struggle to find a way to illustrate complex information effectively, which can hinder progress. This slide provides a Risk Management Matrix that simplifies the presentation of project phases—Initiating, Planning, Execution, and Closure—along with their associated risk perceptions.
Business analysts and strategy consultants often rely on clear visual aids during client presentations or internal reviews. This slide is designed to help you articulate risks in a way that supports informed decision-making, whether you’re developing a new product or conducting a risk assessment for an ongoing project.
It’s perfect for anyone needing a concise yet comprehensive overview in stakeholder meetings. For only $0.99, this slide is easy to download and edit in both PowerPoint and Google Slides. You can tailor it to your specific project needs and have it ready for your next presentation in just minutes.
$0.99 – Purchase Checkout
Added to cart