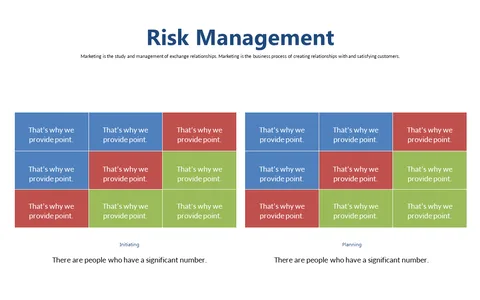
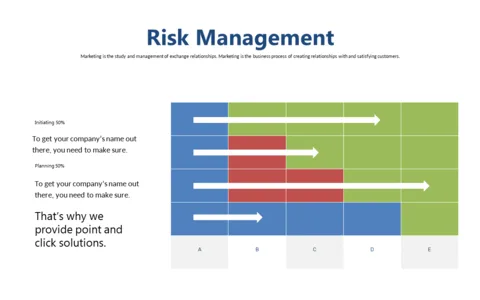
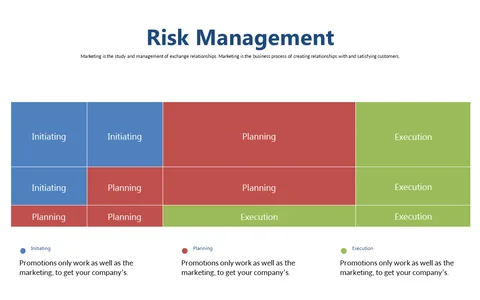
Risk Management Grid for Stage Comparison
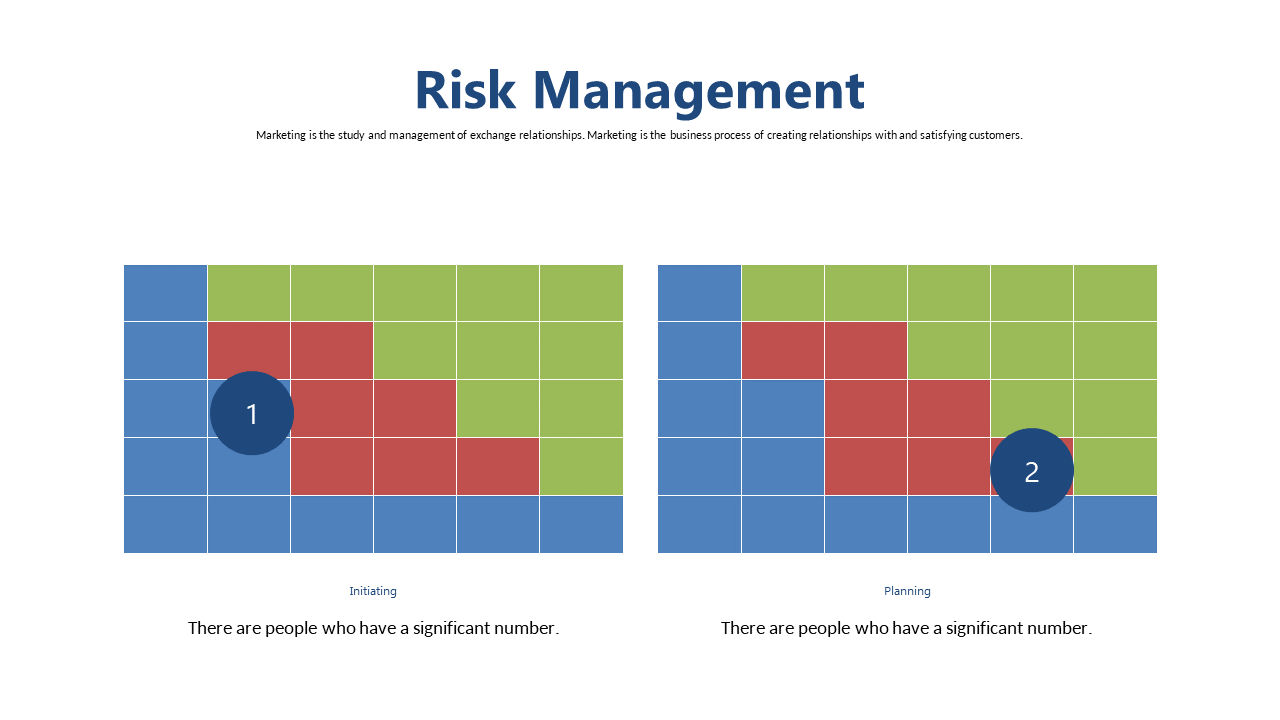
Product Description
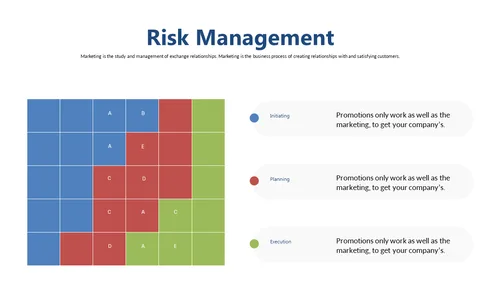
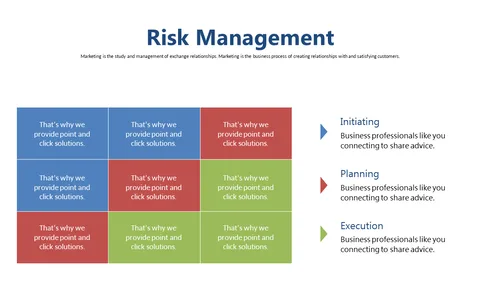
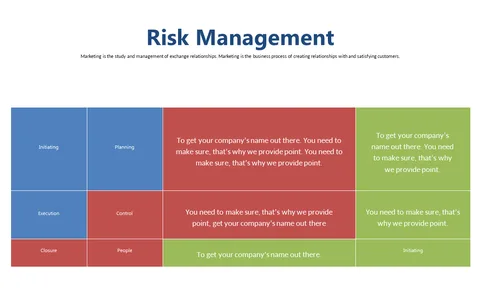
Comparing different stages of risk management can often feel like navigating a complex puzzle without the right tools. This risk management grid offers a clear visual representation that distinguishes between the Initiating and Planning stages, making it simpler for you to analyze and discuss essential aspects of each phase.
This slide is a great resource for project managers, risk analysts, and business strategists in sectors such as manufacturing, finance, or technology. Use it in strategic meetings or risk assessments to facilitate discussions and enhance decision-making.
For only $0.99, you can download this slide instantly and customize it in PowerPoint or Google Slides. Don’t miss out on this opportunity to simplify your risk management discussions today.
$0.99 – Purchase Checkout
Added to cart