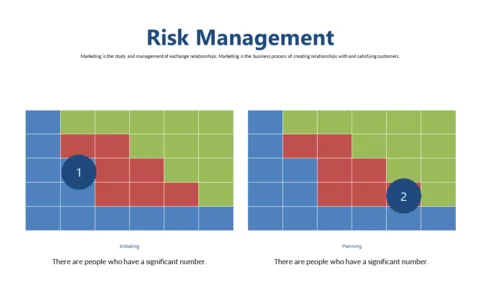
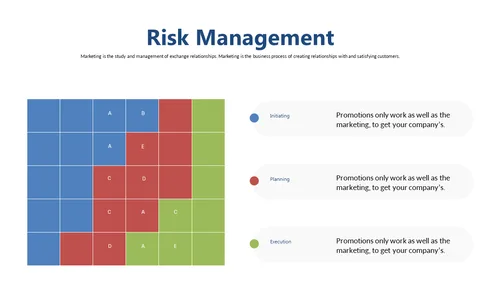
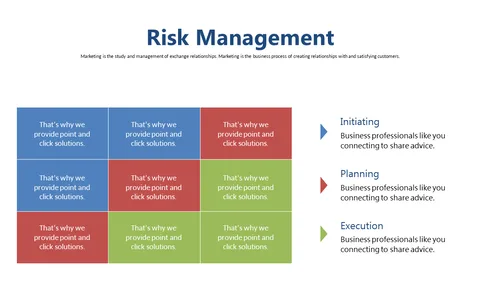
Visualize Risk Management Stages with Arrows Matrix

Product Description
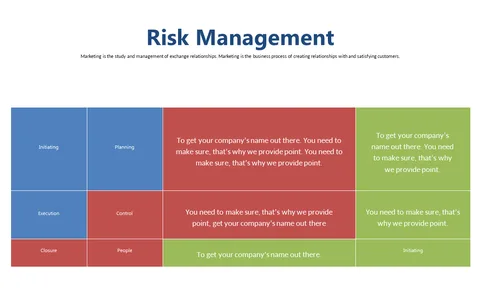
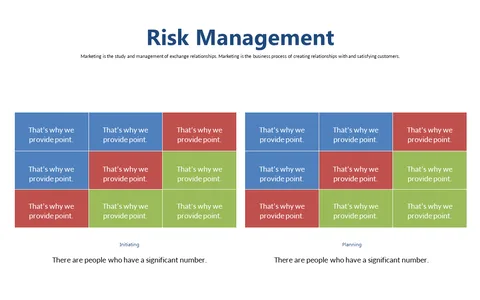
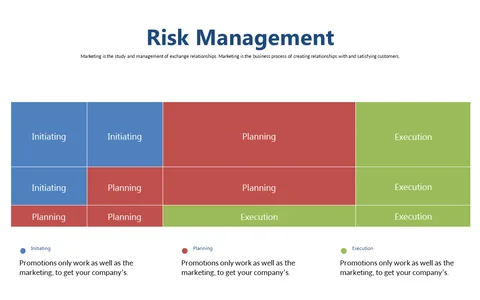
When you’re tasked with presenting risk management strategies, clarity is key. This slide uses a matrix design with arrows that visually guide your audience through different stages of risk management, making complex information easier to digest. The straightforward layout is designed to help you present your ideas effectively and keep your audience engaged.
An operations manager can use this slide to map out the risk mitigation process during a project meeting, ensuring everyone is on the same page. An audit lead might find it essential for summarizing findings in a report, making it clear where potential risks lie. Meanwhile, a risk manager can benefit from this visual tool to articulate strategies for managing uncertainties in an upcoming presentation.
Customization is simple; edit the colors and values to align with your company’s branding or the specifics of your project.
$0.99 —
add this single slide to any deck from the SlideSwift Slide Library. No subscription needed. Mix slides from any category to build your perfect deck.
$0.99 – Purchase Checkout
Added to cart