Showcase Market Comparison with Quadrant Analysis
Product Description
Understanding the market landscape is crucial, yet presenting that information effectively can be challenging. You want to make sure your audience can grasp important comparisons quickly.
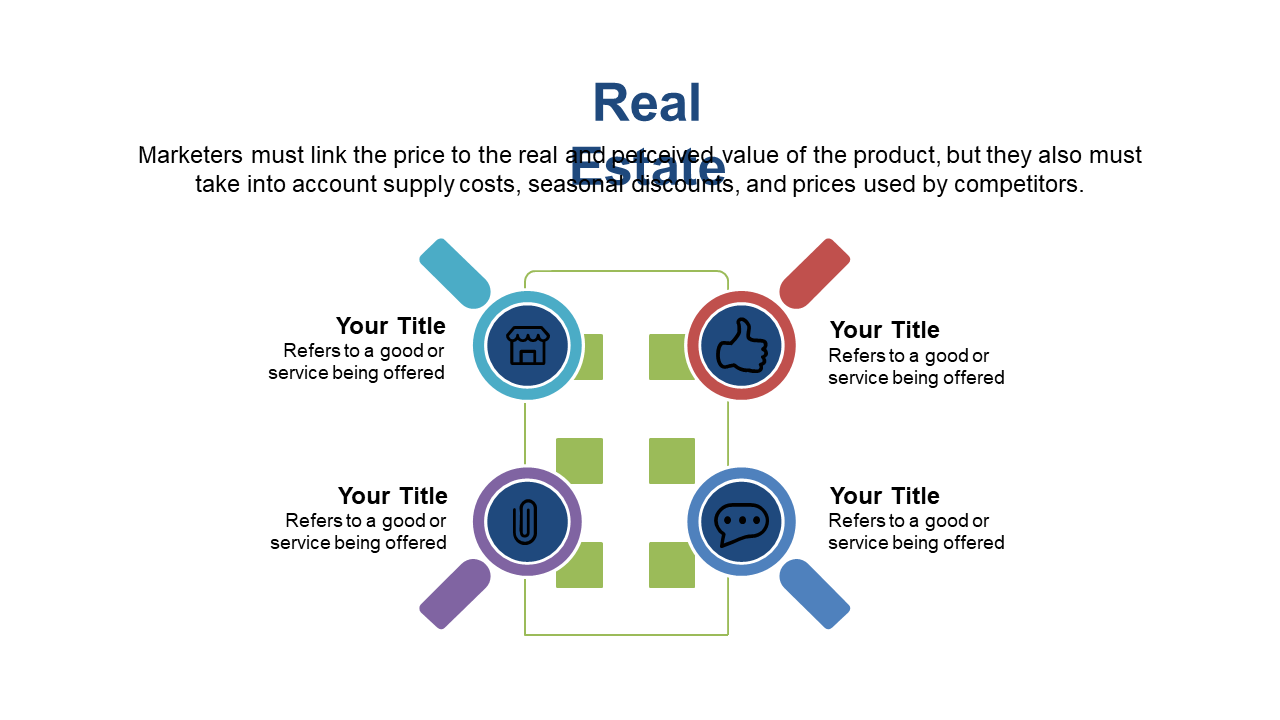
This slide features a quadrant analysis layout that organizes complex data visually, making it easier for stakeholders to understand your insights at a glance. This slide is ideal for market researchers, business developers, and real estate analysts preparing for investor meetings or sales pitches. It provides a straightforward way to represent various market factors during team discussions or industry conferences, ensuring everyone is on the same page.
At a price of just $0.99, this slide is ready for instant download. You can easily edit it in PowerPoint or Google Slides, customizing it to fit your specific market analysis and presenting it in a polished format within minutes.
$0.99 – Purchase Checkout
Added to cart







