Analyze Real Estate Pricing Strategies with Comparison
Product Description
Understanding and communicating real estate pricing strategies can be a daunting task, particularly when you want to compare different approaches effectively. Without a clear visual aid, the subtleties of pricing can easily become muddled.
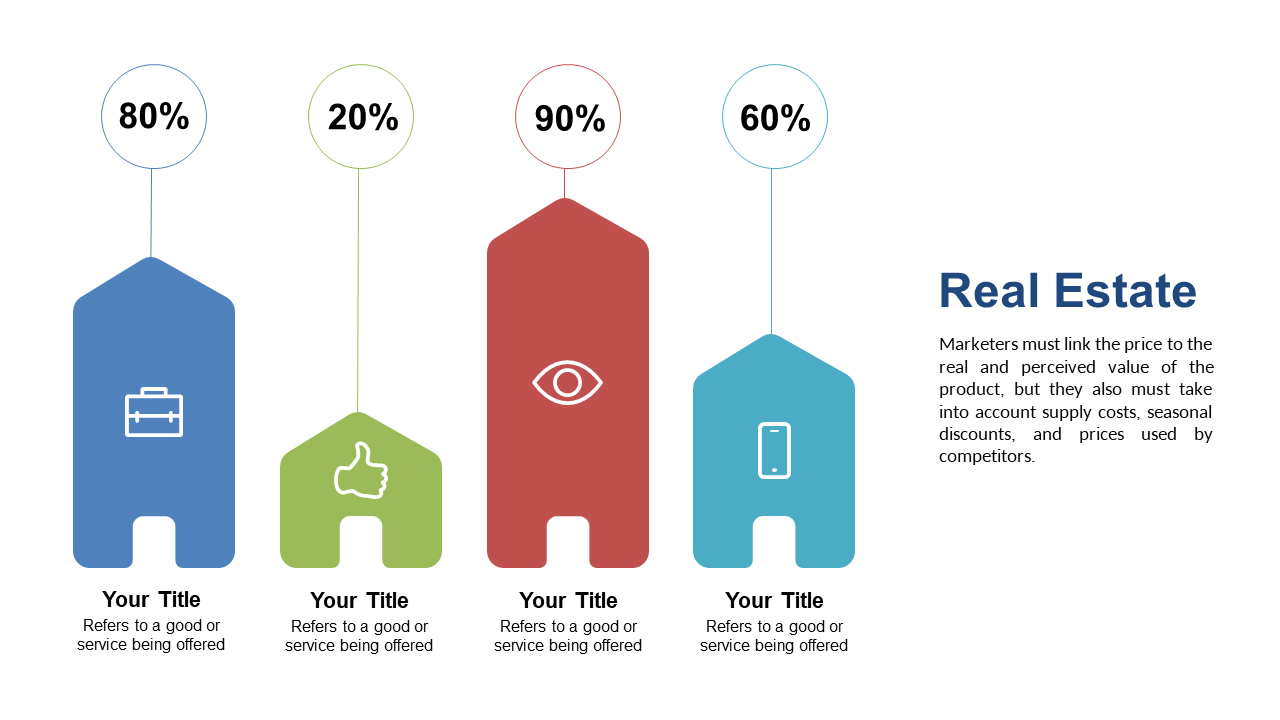
This slide presents a straightforward comparison of various pricing strategies, helping you convey critical information clearly. Market analysts, real estate agents, and financial advisors will find this slide particularly beneficial when discussing property valuations or pricing tactics. Use it during strategy meetings, client presentations, or training sessions to illustrate the differences between perceived and actual prices in an engaging way.
For only $0.99, you can download this slide instantly, allowing for easy customization in PowerPoint or Google Slides. You can have it tailored to your needs and ready to present in a matter of minutes.
$0.99 – Purchase Checkout
Added to cart







