Highlight Cost Breakdown in Your Purchase Funnel

Product Description
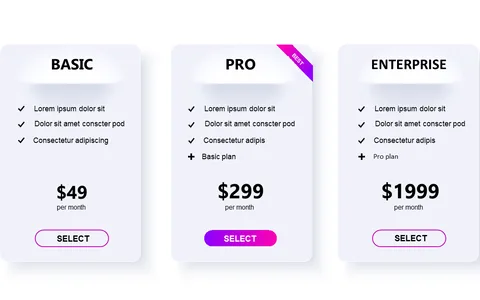
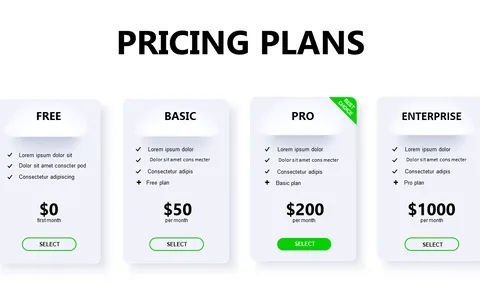
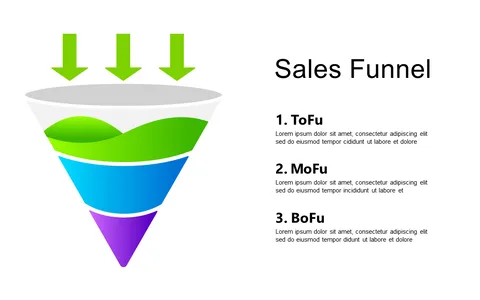
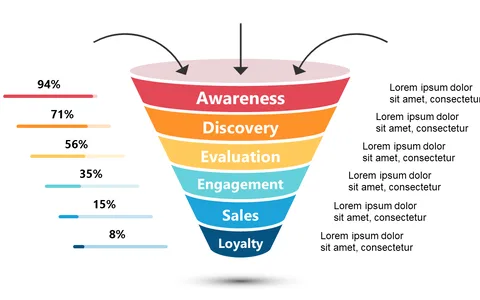
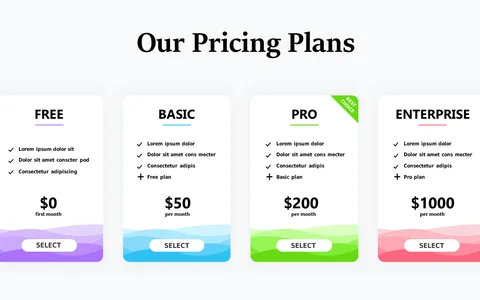
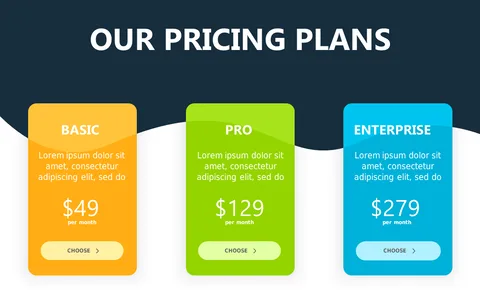
When you’re trying to boost conversions, presenting a transparent pricing structure is essential. Your audience needs to see not just the numbers, but the value behind them. This slide offers a clear layout to highlight the different cost points within your purchase funnel, simplifying complex pricing into an easily digestible format.
Finance professionals and sales consultants will find this slide invaluable during budget discussions, financial reviews, or client consultations. If you aim to clarify your offerings or analyze pricing strategies, this visual tool helps your audience understand the financial implications of each tier.
It’s perfect for making data-driven decisions. For just $0.99, you can download this slide instantly and edit it in PowerPoint and Google Slides. It’s ready for you to customize in just a few minutes, making your presentations more compelling.
$0.99 – Purchase Checkout
Added to cart