Illustrate 5-Step Project Management Process Clearly
Product Description
When leading a team, articulating the complexities of project management can feel daunting. You want to ensure your audience understands the process without being overwhelmed by details.
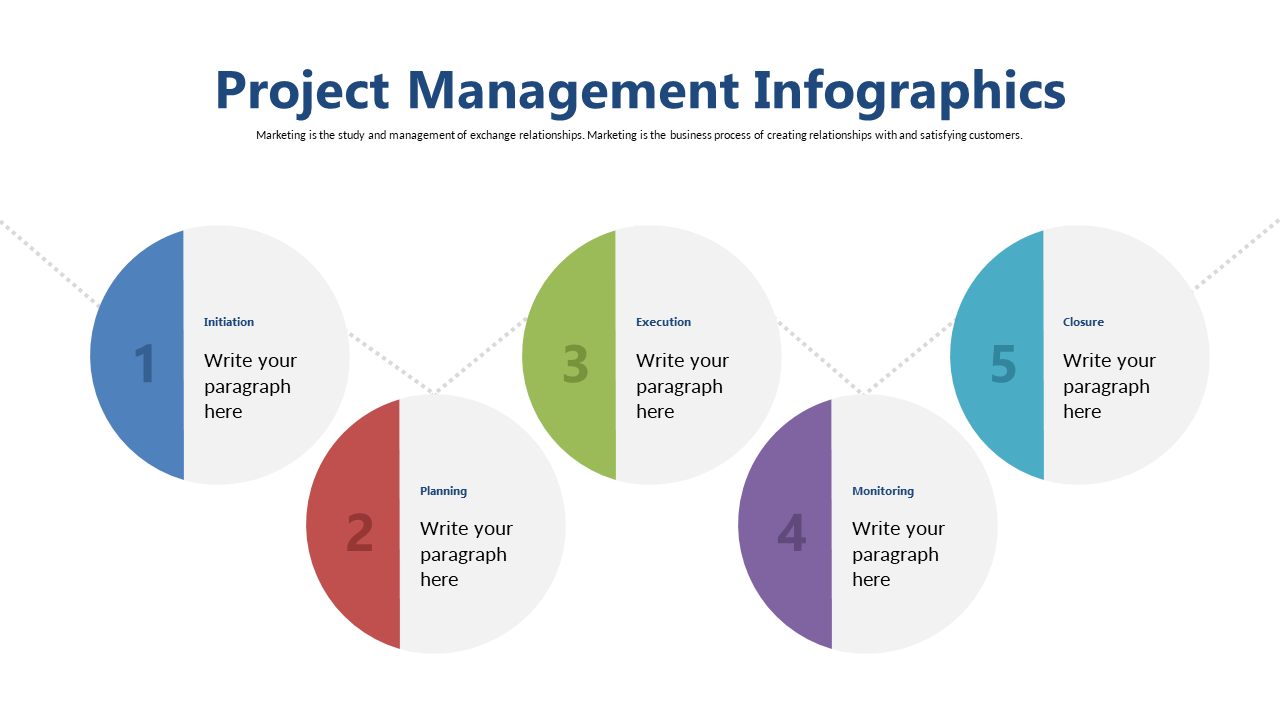
This circular infographic breaks down the key steps involved in project management, providing a simple yet effective representation of the workflow. Suitable for project managers, consultants, and team leaders, this slide works perfectly in presentations aimed at training sessions, project updates, or strategic planning meetings. It offers a handy reference for both new and seasoned team members, helping them to easily grasp the essentials of the process.
At just $0.99, you can download this slide instantly, with full editing capabilities in PowerPoint and Google Slides. Customize it in minutes to suit your project narrative and make your presentations more effective.
$0.99 – Purchase Checkout
Added to cart







