Engage Teams with Project Management Workflow Infographic

Product Description
Managing a project without clear communication can lead to misunderstandings and missed deadlines. Complex workflows often leave teams confused and struggling to grasp their roles, making it harder to stay on track.
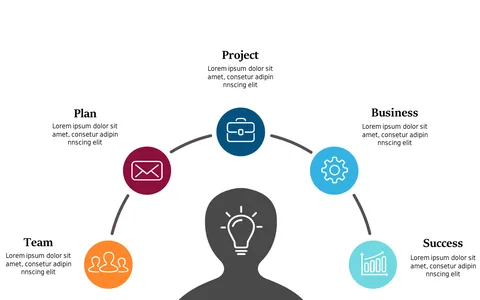
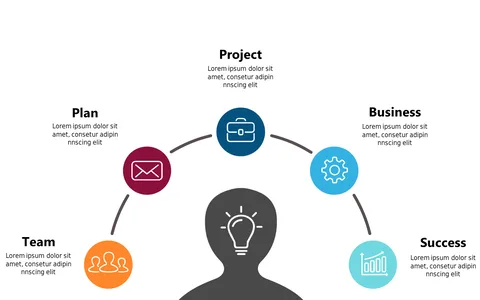
This engaging infographic simplifies the process, making it easy to convey the various stages of project management from start to finish. Operations managers, project coordinators, and team facilitators will find this slide particularly effective during kickoff meetings or progress updates. Use it to help your team visualize the transition from initiation to closure, ensuring everyone is aligned and aware of their responsibilities.
For only $0.99, this slide is an instant download, easily editable in PowerPoint and Google Slides. Get it today and start improving your project presentations in just minutes.
$0.99 – Purchase Checkout
Added to cart