Communicate Project Stages with Vibrant Infographic

Product Description
Communicating project stages effectively can often feel like an uphill battle for project managers. The challenge lies in ensuring your team and stakeholders grasp the critical phases of a project without getting lost in jargon or confusion.
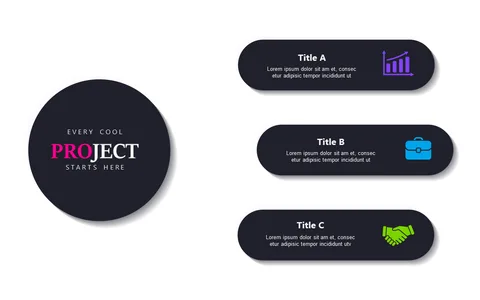
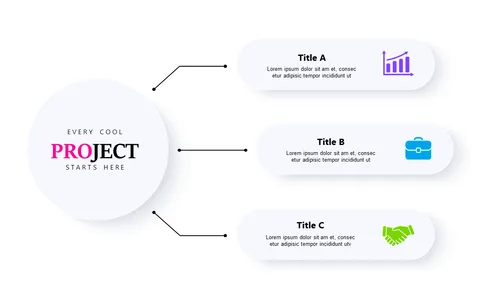
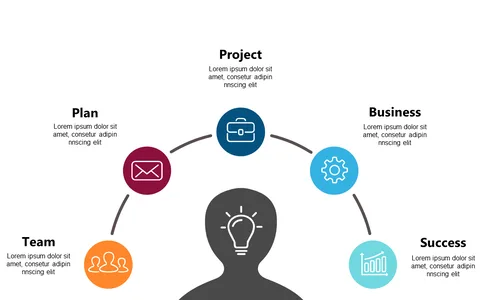
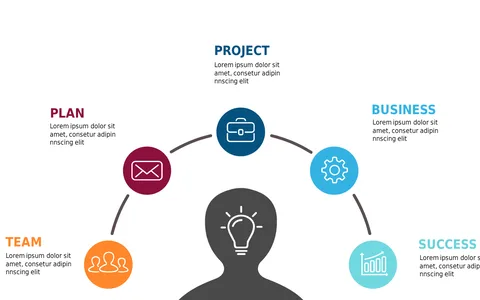
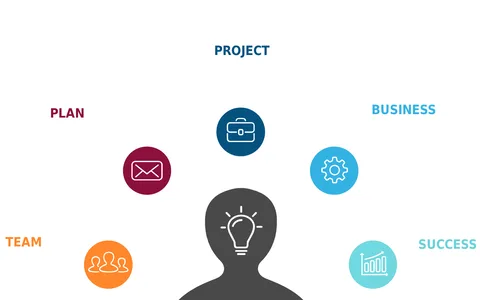
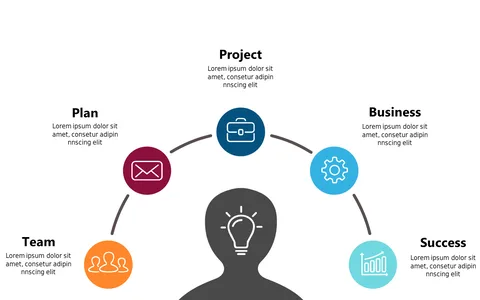
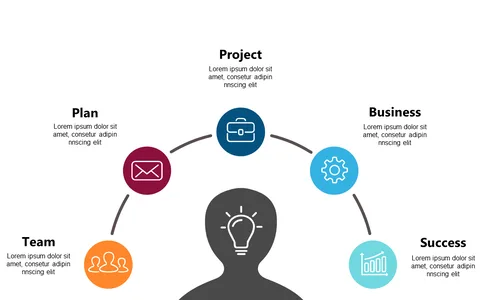
This vibrant infographic simplifies that process, making it easier to convey information at a glance. This slide is perfect for project managers in fields such as construction, software development, and marketing when presenting progress updates or project kickoffs. Use it during team meetings, stakeholder briefings, or project status reports to clarify where you are in the project lifecycle and what’s coming next.
At just $0.99, this slide is an instant download, easily editable in both PowerPoint and Google Slides. You’ll be ready to communicate those project stages in minutes, transforming your presentations into engaging discussions.
$0.99 – Purchase Checkout
Added to cart