Showcase Project Delivery with Flow Diagram
Product Description
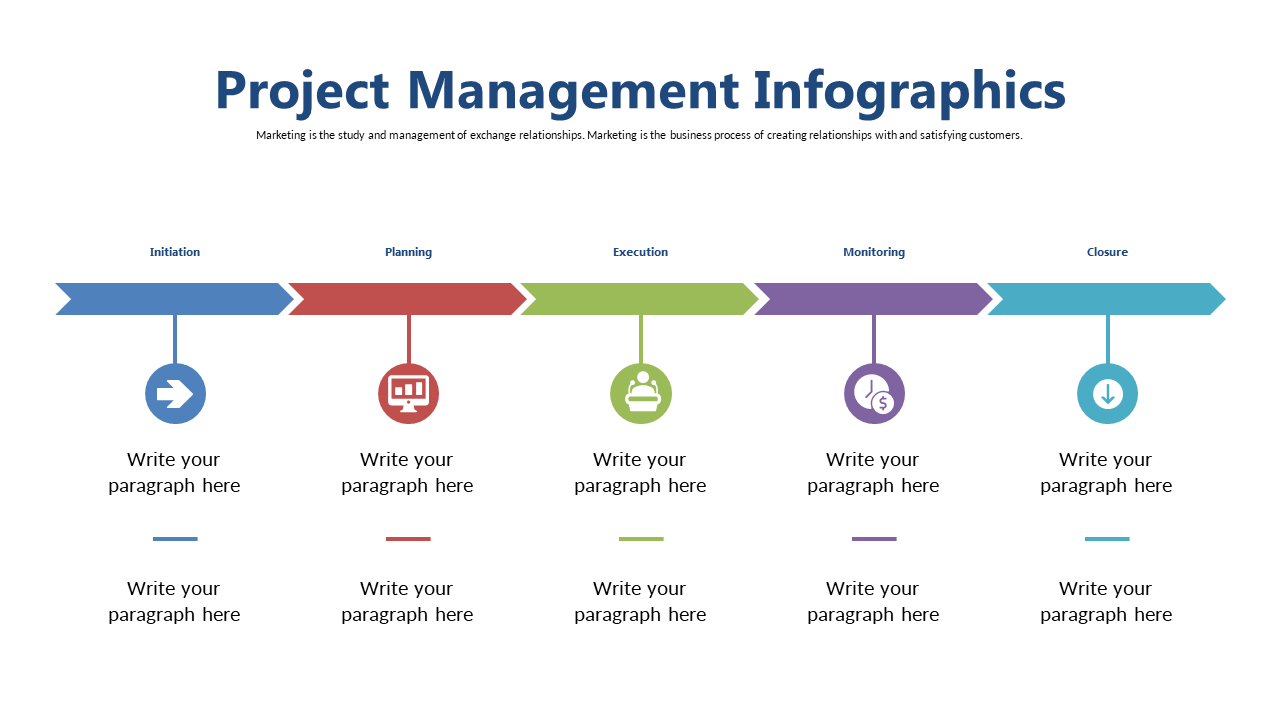
Visualizing project delivery and the key phases involved can be a significant hurdle, particularly when communicating with team members or external stakeholders. This flow diagram slide breaks down the five main phases—Initiation, Planning, Execution, Monitoring, and Closure—into a clear and structured format that enhances understanding.
This slide is great for project managers, business consultants, and team leads during client presentations, progress reports, or project briefings. It helps ensure that everyone involved understands the delivery process and their individual contributions, making for more productive discussions.
For only $0.99, you can download this slide instantly, and it’s fully editable in both PowerPoint and Google Slides. It’s straightforward to personalize, allowing you to quickly prepare it for your next presentation.
$0.99 – Purchase Checkout
Added to cart







