Communicate Project Management Aspects Visually
Product Description
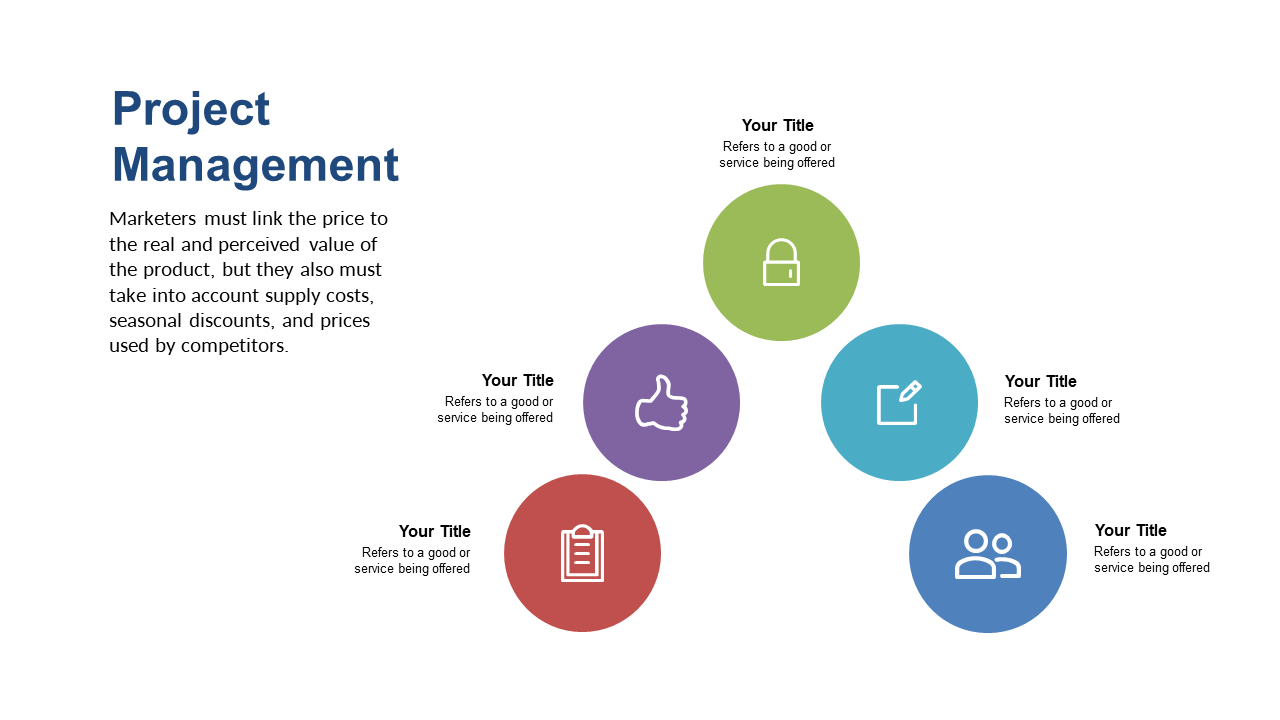
Every operations manager faces the uphill battle of conveying intricate project details to their team without losing their attention. Complex information can quickly overwhelm audiences, making it essential to find a way to simplify these concepts visually. This slide presents key project management aspects in a vibrant and engaging manner, making it clear and digestible.
You’ll find this slide incredibly useful in team meetings, quarterly project reviews, or even during client presentations. Whether you’re an operations manager, a project coordinator, or a team lead, this visual aid will help you engage everyone involved in the project, allowing for better understanding and collaboration.
It’s perfect for illustrating the relationship between different project components. Download it for just $0.99, and you’ll have instant access. It’s fully editable in PowerPoint and Google Slides, so you can adjust the design to fit your needs in mere minutes.
$0.99 – Purchase Checkout
Added to cart







