Visualize Project Tasks with Circular Steps

Product Description
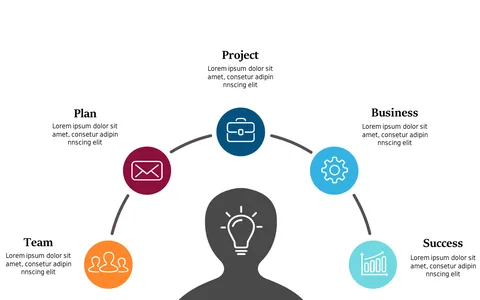
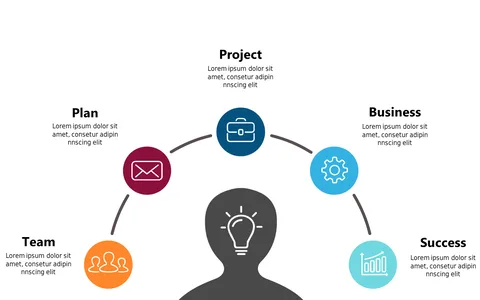
When you’re managing a project, simplifying complex tasks into digestible pieces can be a real headache. This slide allows you to visualize project stages through circular steps, making it easy for everyone to understand the flow without getting lost in details. It’s designed to keep your audience engaged while delivering clarity.
Project managers across industries will find this slide especially helpful during team meetings, status updates, or client presentations. Whether you’re working in IT, construction, or marketing, this circular step layout will guide your team through each phase, ensuring that everyone is on the same page and aware of their roles in the project timeline.
You can download this slide for just $0.99. It’s instantly available and easily editable in PowerPoint and Google Slides, so
you can customize it to fit your project’s unique needs in no time.
$0.99 – Purchase Checkout
Added to cart