Showcase Service Progression with Wavy Step Process
Product Description
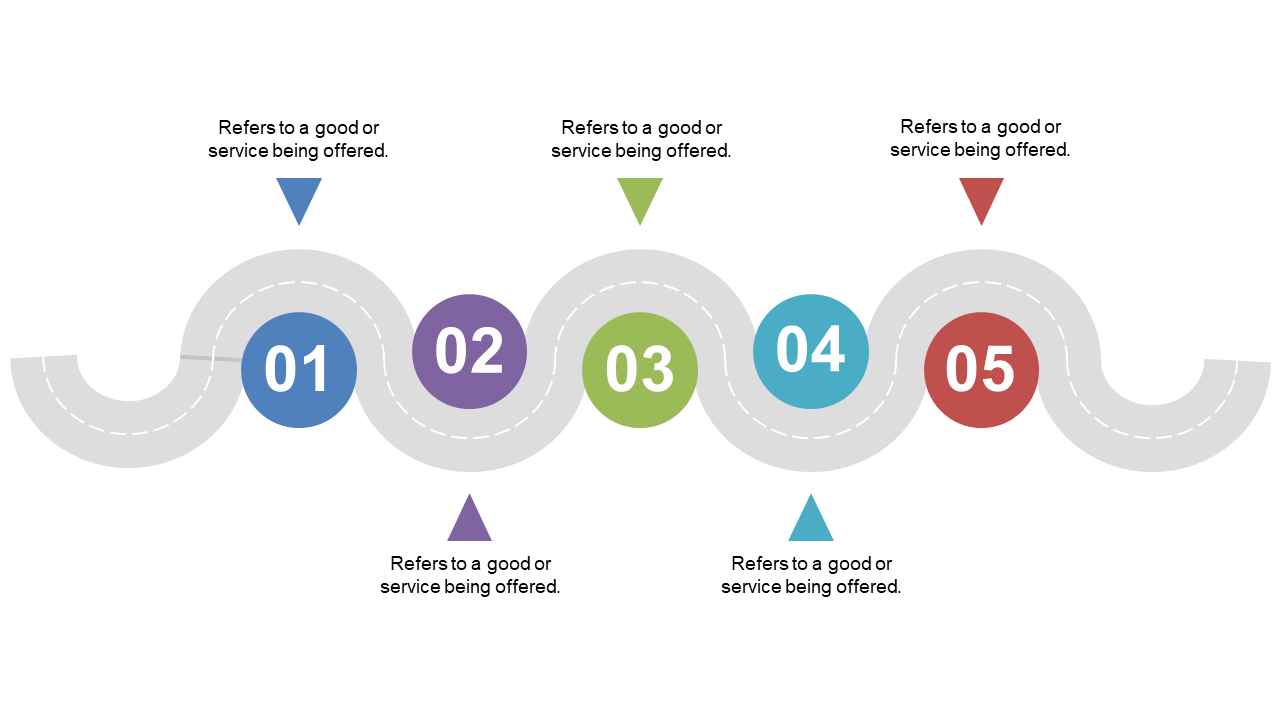
When explaining the progression of your services, clarity can make all the difference in securing buy-in from your audience. This wavy step process slide visually represents each stage with numbered indicators, guiding your audience through the timeline. It’s not just functional; it’s also engaging, making your explanation more memorable.
Project managers and service directors can employ this slide during service delivery presentations or when onboarding clients. It’s also useful for marketing teams showcasing campaign timelines.
No matter your role, this layout will ensure your audience understands each step of your service progression. At only $0.99, this slide is available for instant download and easy customization in PowerPoint or Google Slides. You’ll be able to tailor it to your needs and present a clear narrative in minutes.
$0.99 – Purchase Checkout
Added to cart







