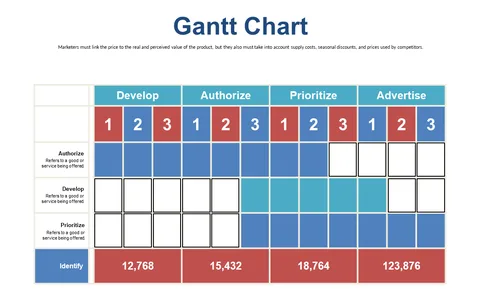
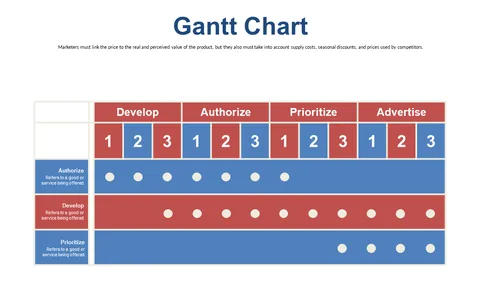
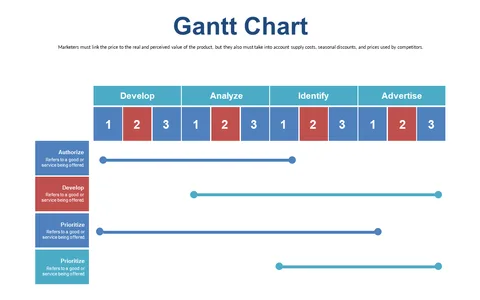
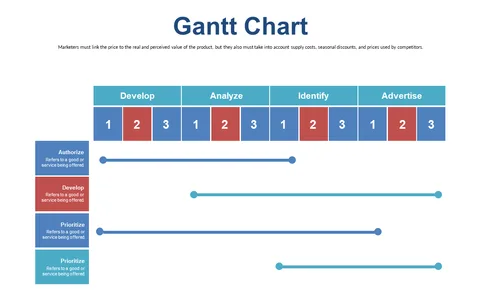
Gantt Chart for Project Workflow Visualization
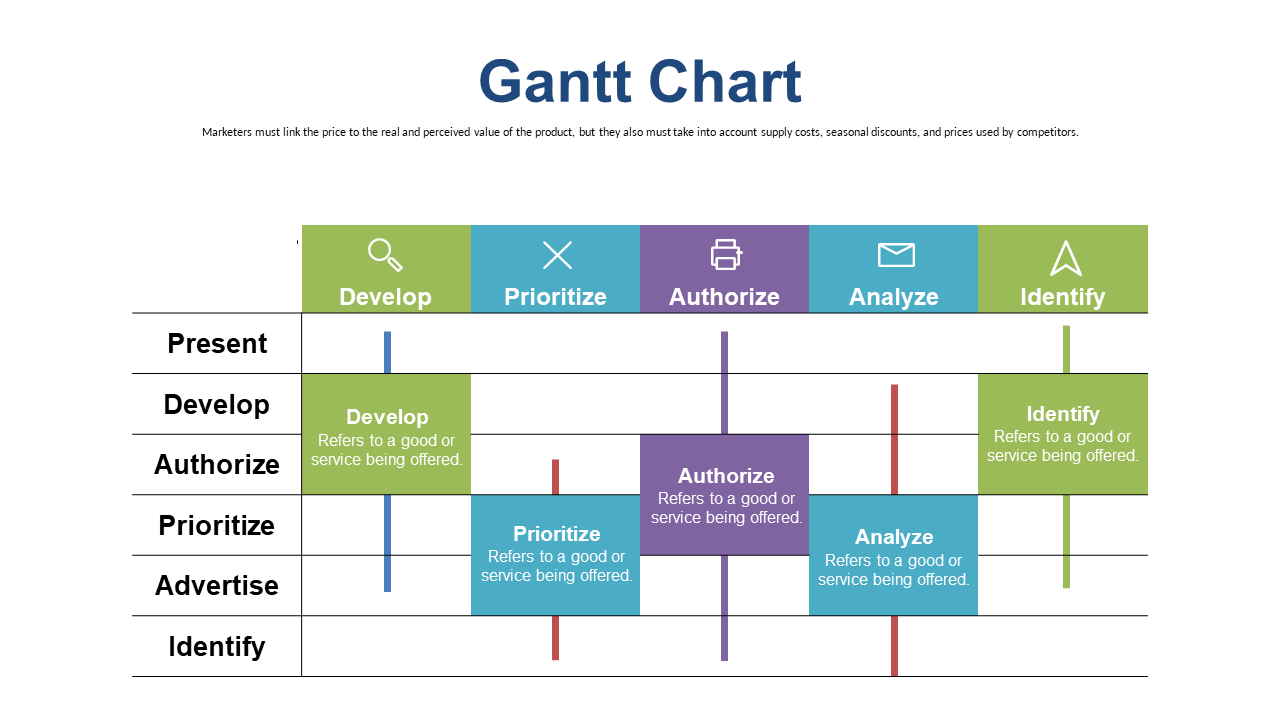
Product Description
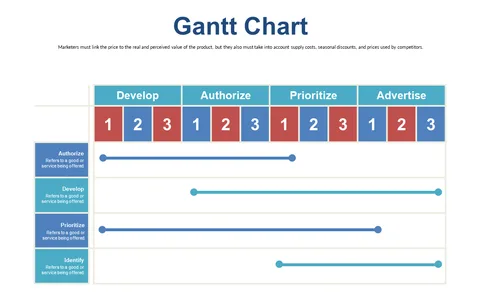
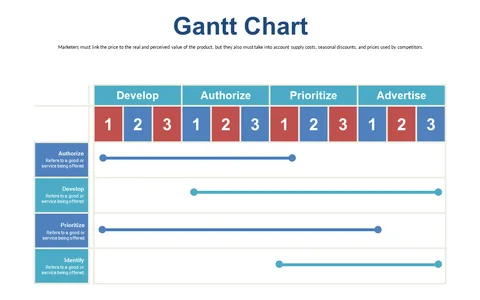
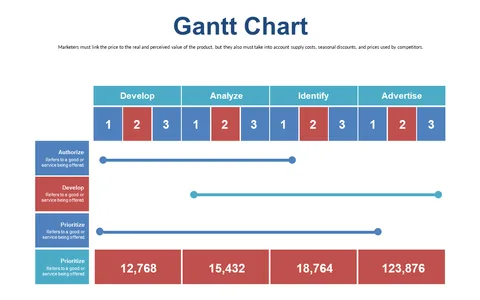
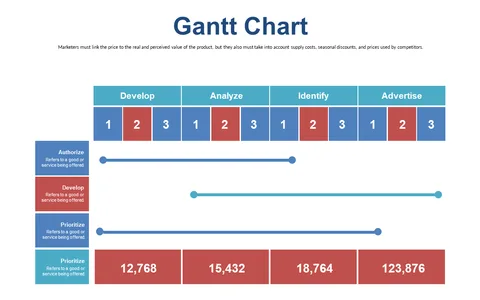
Juggling multiple project timelines can feel daunting, especially when deadlines loom. This Gantt chart slide provides a straightforward visual of your project workflows, making it easy to see task dependencies and timelines at a glance. Its clean layout allows you to convey complex project details simply, reducing miscommunication and keeping your team focused.
Project managers, operations coordinators, and team leaders can utilize this slide during project updates, planning sessions, or resource allocation meetings. It’s designed to help you and your team visualize progress, identify bottlenecks, and stay on schedule, no matter how intricate the project gets. Your colleagues will appreciate the clarity it brings to their roles and responsibilities.
For only $0.99, you can download this slide instantly and start editing it in PowerPoint or Google Slides. It’s ready to use, allowing you to focus on managing your projects efficiently. Make your project management easier with this essential Gantt chart!
$0.99 – Purchase Checkout
Added to cart