Plan Project Timelines with Editable Gantt Chart
Product Description
Managing project timelines can quickly turn into a complex puzzle, especially when deadlines are fast approaching. You need a clear way to map out each phase and ensure everyone remains on the same page.
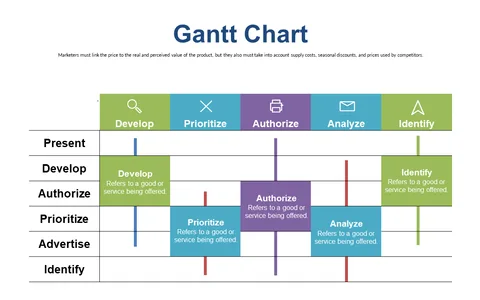
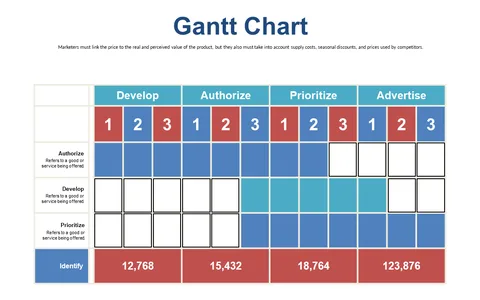
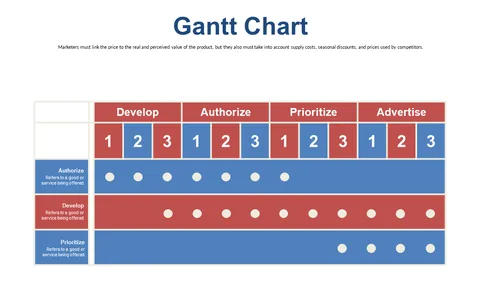
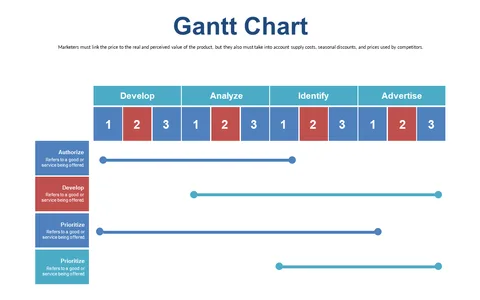
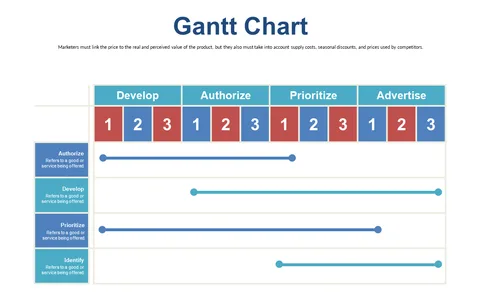
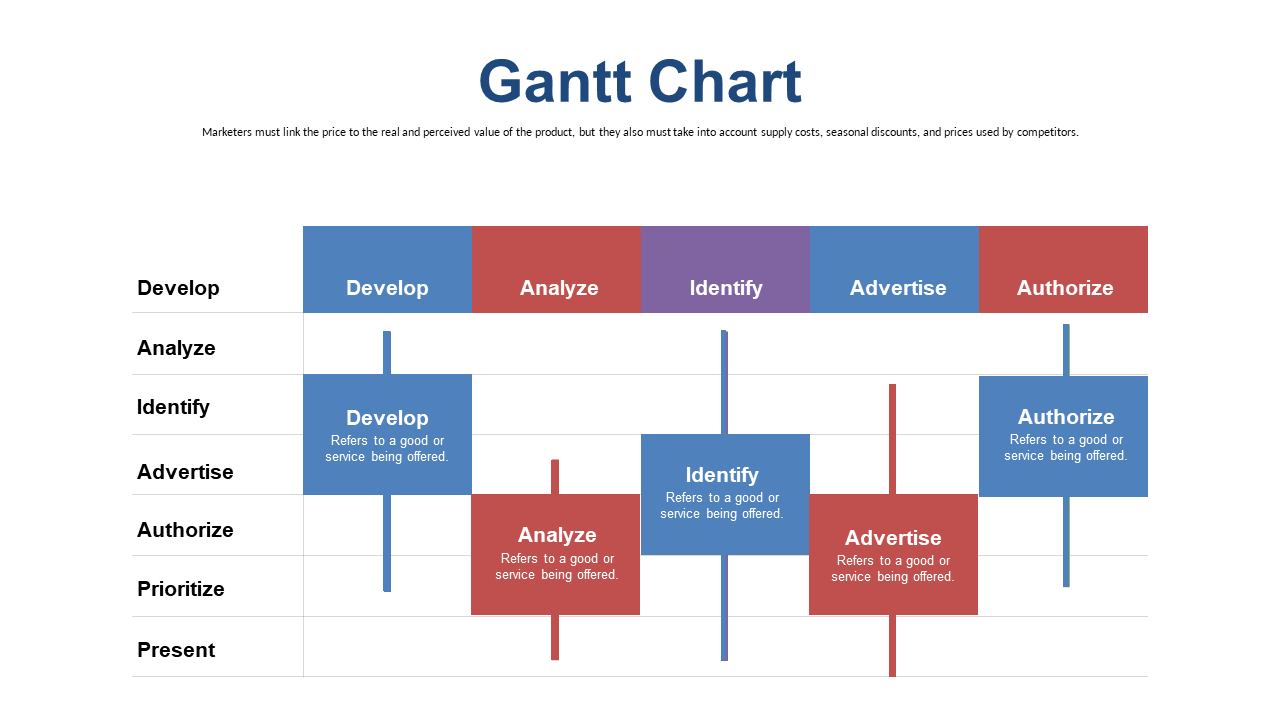
This editable Gantt Chart slide allows you to visually represent project timelines and task responsibilities, making alignment simple. Especially beneficial for project coordinators and team leaders in industries like IT or product development, this slide is perfect for weekly planning meetings or progress discussions. Use it to illustrate the steps needed to meet your goals, helping your team stay focused.
For only $0.99, this slide is available for immediate download and can be easily customized in PowerPoint or Google Slides. It’s straightforward to edit, so you can have it ready to go in just minutes.
$0.99 – Purchase Checkout
Added to cart