Color-Coded PESTLE Analysis for Strategic Insights
Product Description
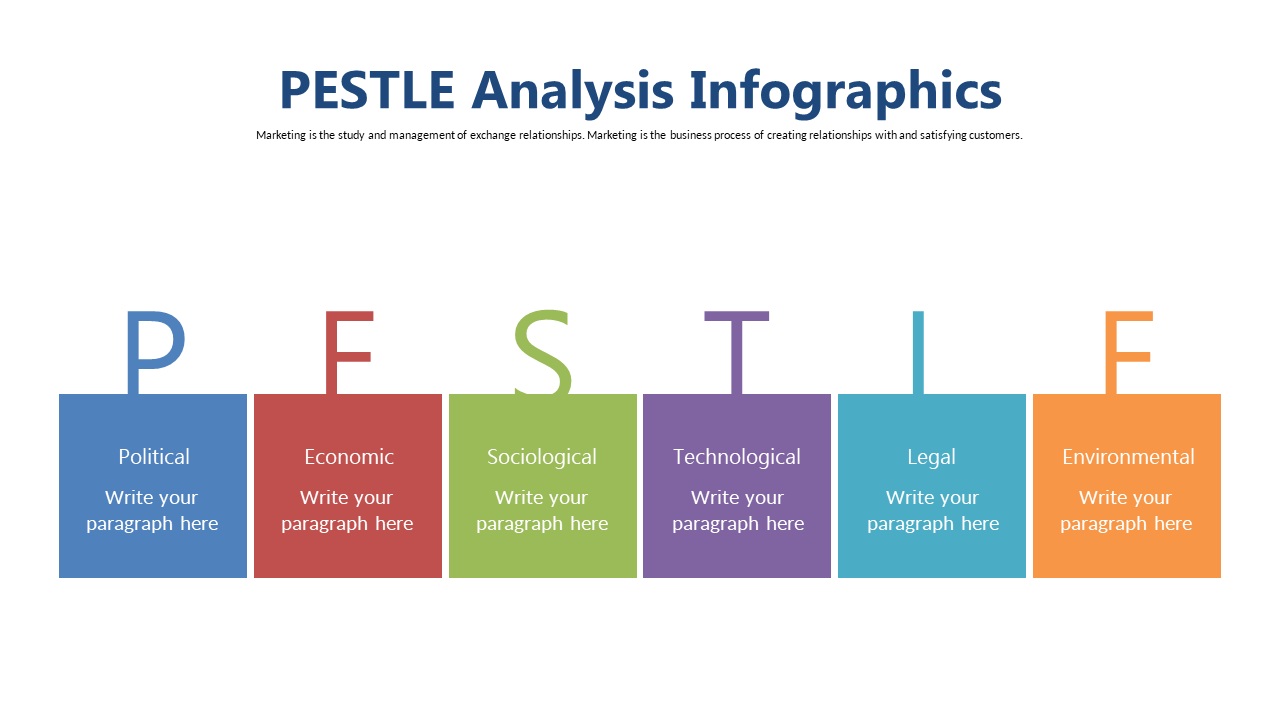
Sorting through vast amounts of data can leave even the most experienced marketing managers feeling overwhelmed. When time is of the essence, a well-structured PESTLE analysis slide like this one can be your best resource for clarity.
Its vibrant, color-coded infographic breaks down essential external factors in a way that’s easy to digest. This slide is particularly useful for marketing managers conducting market research or strategy meetings. Imagine using it to summarize findings in a team briefing or during a presentation to upper management, where you need to keep everyone on the same page while navigating complex insights.
At only $0.99, this slide is available for instant download. It’s straightforward to edit in PowerPoint and Google Slides, allowing you to present polished insights in no time.
$0.99 – Purchase Checkout
Added to cart







