Illustrate Product Value Perception with Gauge Charts
Product Description
Differentiating your product in a competitive market often hinges on how well you present its value perception. Many professionals find it challenging to communicate this aspect effectively.
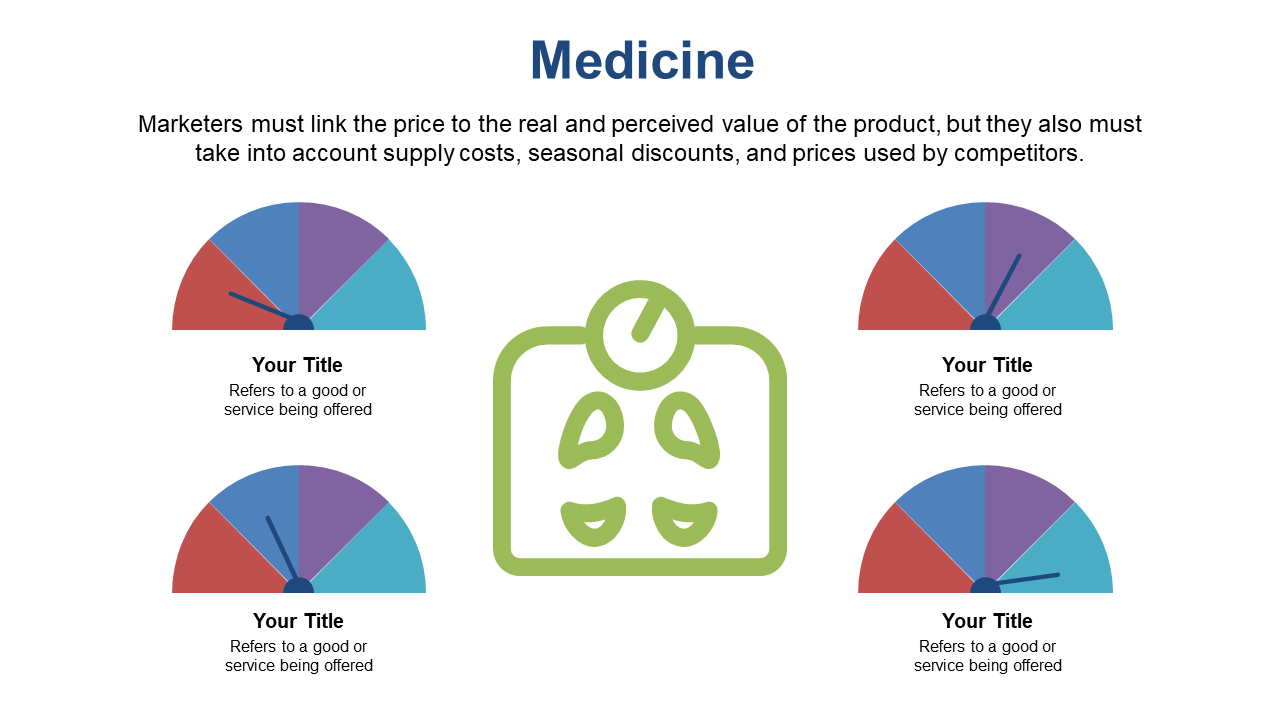
With a visually engaging gauge chart, this slide provides a clear way to illustrate how your product compares to others, making your case more compelling. This template is particularly useful for product managers or marketing analysts in the technology or medical fields, especially when presenting during competitive analysis meetings or strategic reviews. It helps drive home the message of your product’s unique value while captivating your audience’s attention.
For just $0.99, this slide is available for instant download and can be easily customized in both PowerPoint and Google Slides. It’s designed for quick use, so you can focus on what matters most—delivering an impactful presentation.
$0.99 – Purchase Checkout
Added to cart







