Visualize Market Analysis with Colored Thermometers
Product Description
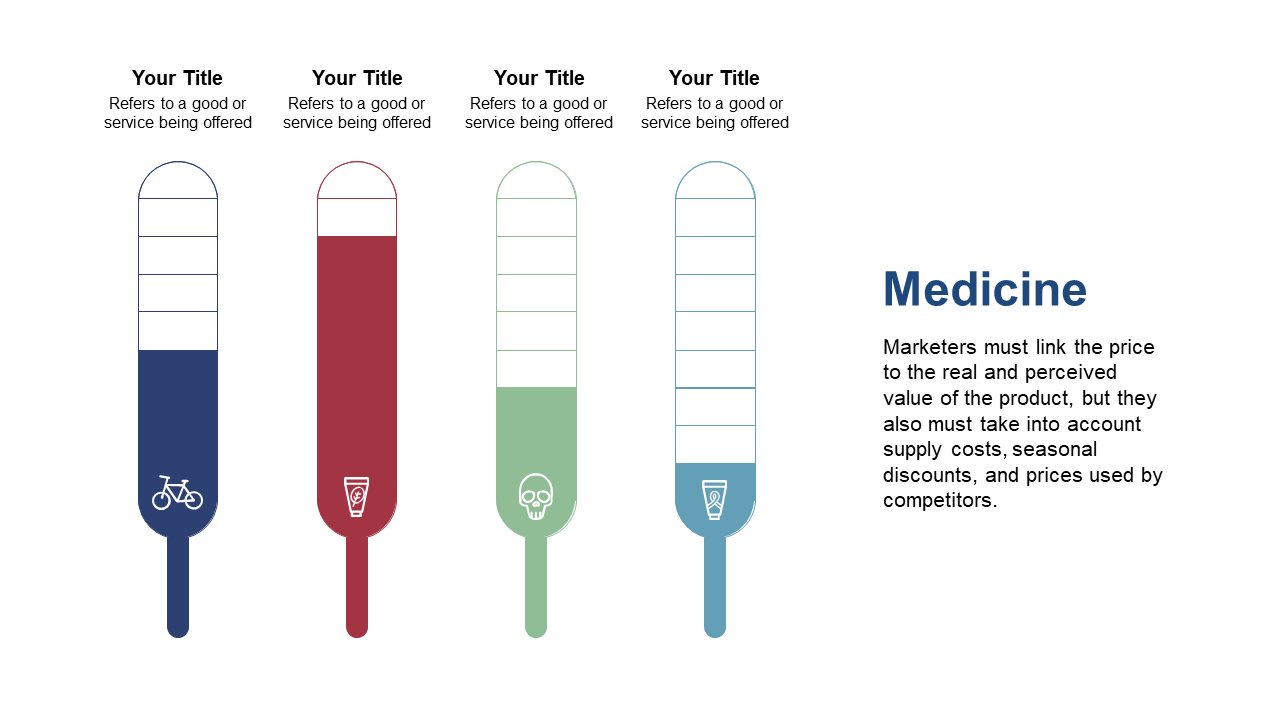
Communicating complex market analysis can be daunting, especially when you need to convey data in a way that catches and holds attention. This slide’s colored thermometer graphics provide a straightforward method for visualizing market trends, making your analysis both accessible and visually appealing.
This slide is perfect for market researchers and business analysts who need to present findings in team meetings or strategy sessions. Whether you’re showcasing sales performance or analyzing consumer behavior, these thermometers will help your audience quickly grasp critical data points.
At only $0.99, this slide is available for quick download and is easily editable in both PowerPoint and Google Slides. You’ll be able to transform your data into a clear visual story in no time!
$0.99 – Purchase Checkout
Added to cart







