Visualize Steps in Processes with Stacked Arrows V2

Product Description
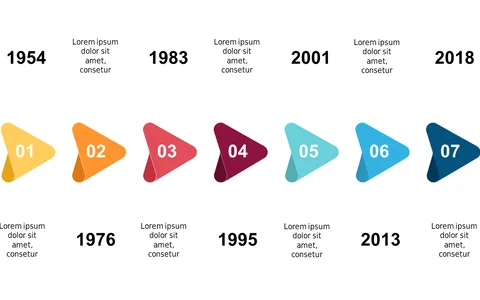
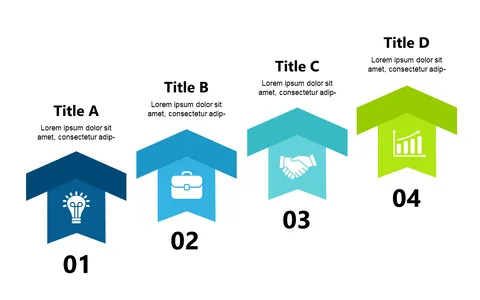
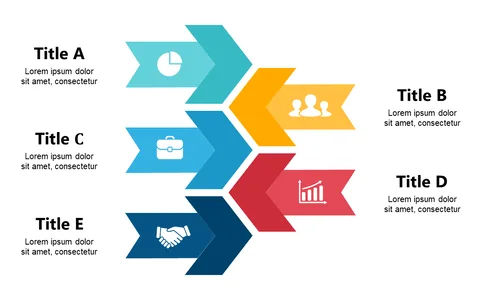
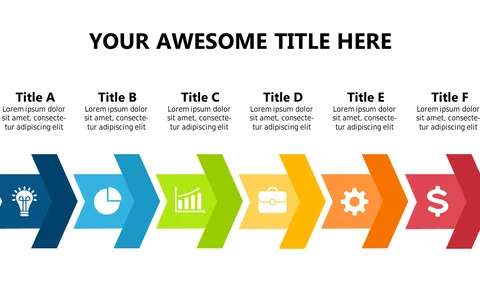
Showing a series of interconnected steps clearly can be tricky, especially when you’re trying to keep your audience engaged. This slide addresses that need by displaying vibrant stacked arrows, each color-coded to illustrate distinct stages, making your points easy to follow and remember.
This is perfect for business analysts detailing process improvements, educators outlining curriculum structures, or team leaders during strategic planning sessions. Each arrow guides your audience through your message, ensuring they grasp the information presented without feeling lost.
Available for only $0.99, this slide is ready for instant download. It’s fully editable in PowerPoint and Google Slides, allowing you to tailor it to fit your specific needs quickly.
$0.99 – Purchase Checkout
Added to cart