Present Sequential Processes with Stacked Arrows
Product Description
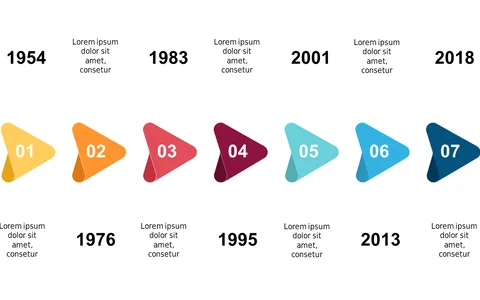
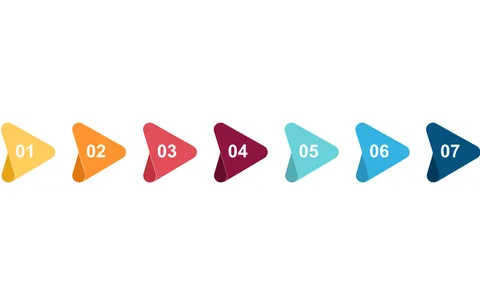
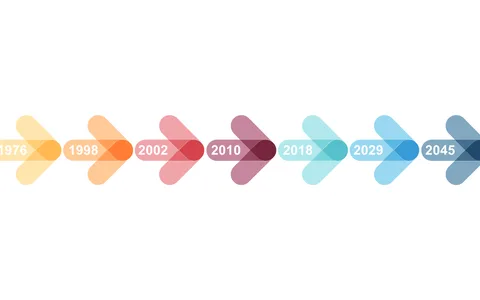
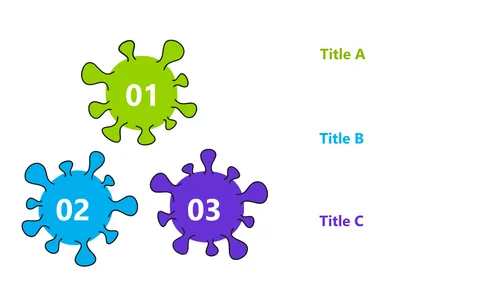
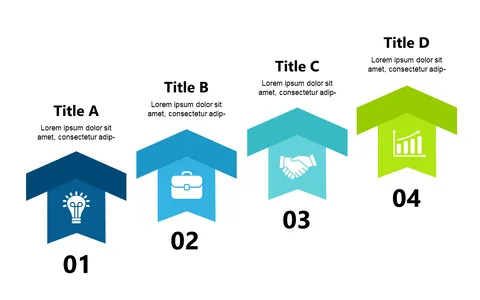
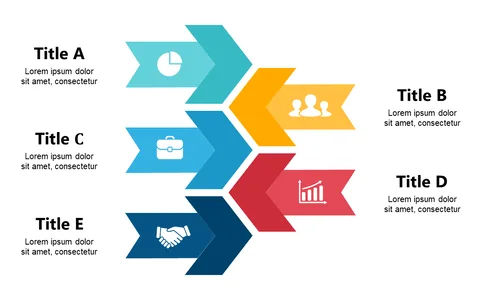
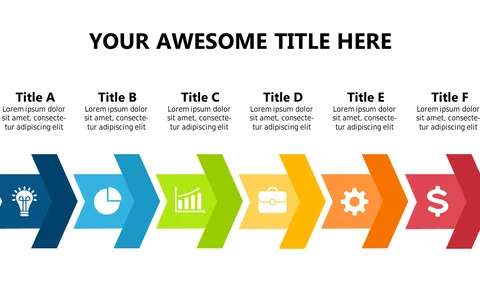
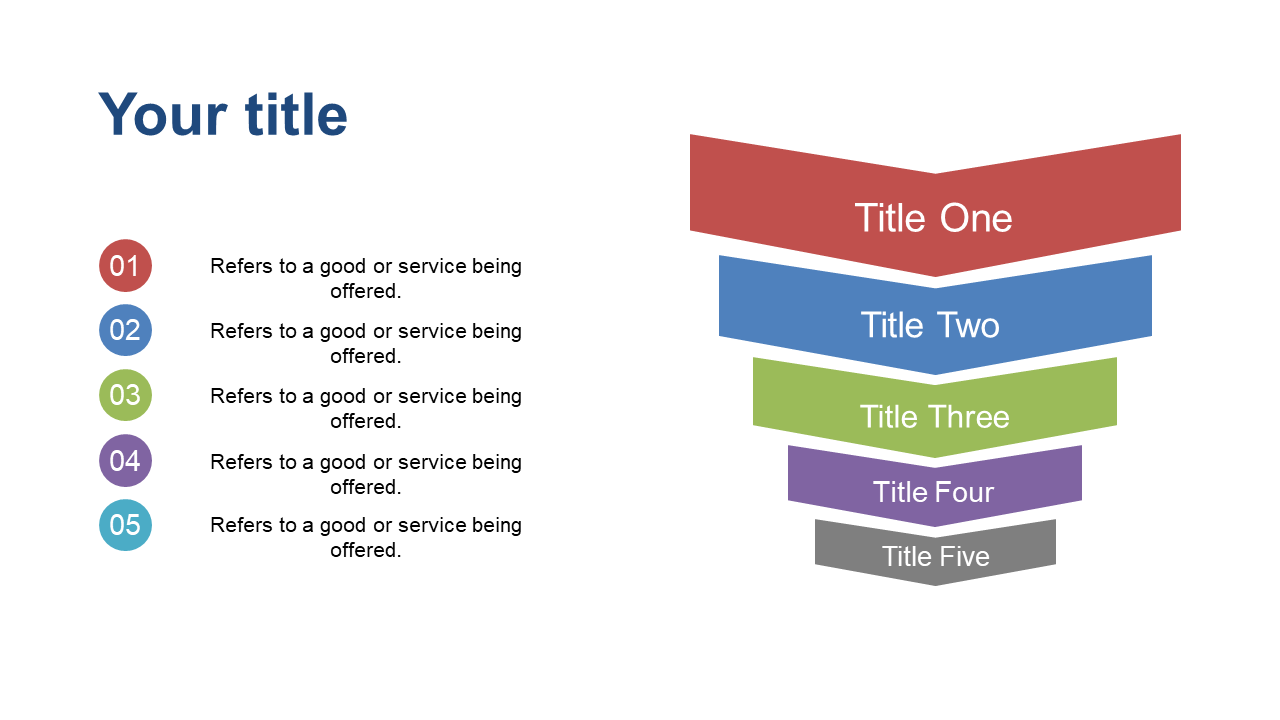
Breaking down complicated processes can often feel overwhelming for both the presenter and the audience. This slide solves that problem by using stacked arrows to represent each step in a sequential flow, making the entire process easier to digest and follow along.
Whether you’re a project coordinator explaining a project timeline, a sales manager outlining the customer journey, or a trainer leading onboarding sessions, this slide is a great fit for driving clarity in your presentations. It helps you guide your audience smoothly through each stage without losing their attention.
You can grab this slide for just $0.99, and it’s available for instant download. Editing is a breeze in PowerPoint and Google Slides, so you’ll be ready to rock your presentation in minutes.
$0.99 – Purchase Checkout
Added to cart