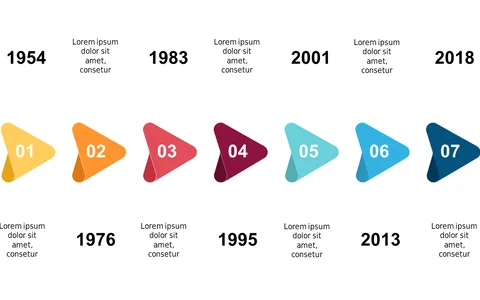
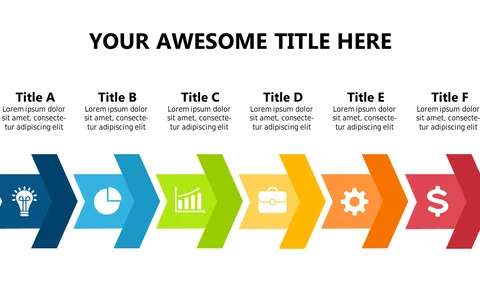
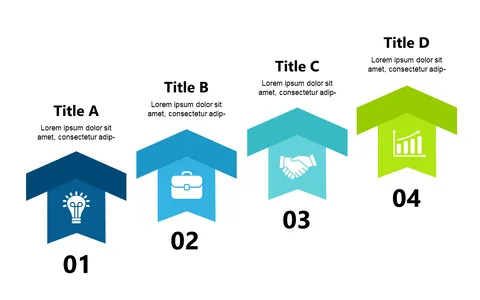
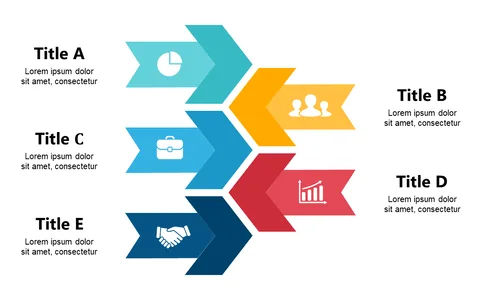
Present Strategy Components with Colorful Horizontal Steps

Product Description
Communicating complex strategies can often lead to confusion, especially when you’re trying to keep your audience engaged. This slide simplifies that challenge by visually breaking down your strategy into colorful horizontal steps, making it easier for your audience to follow along and understand the key components.
Perfect for team leaders in marketing, project managers, or executives presenting during strategy sessions, this slide helps you clearly outline the various elements of your plan in a way that resonates. Whether you’re pitching a new initiative or reviewing quarterly goals, it keeps your audience focused on the essentials.
Available for just $0.99, this slide is ready for instant download and is easy to edit in both PowerPoint and Google Slides.
You can customize the colors and labels to fit your needs in just minutes.
$0.99 – Purchase Checkout
Added to cart