Illustrate Market Dynamics with Venn Diagram
Product Description
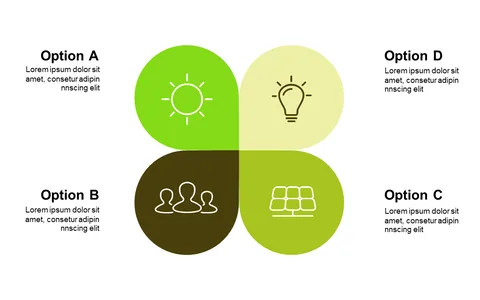
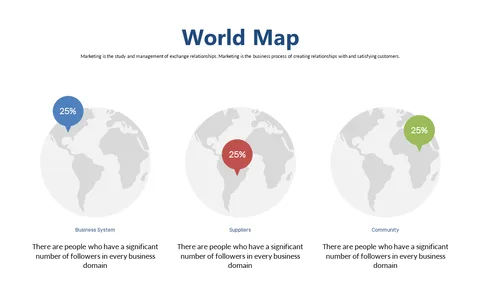
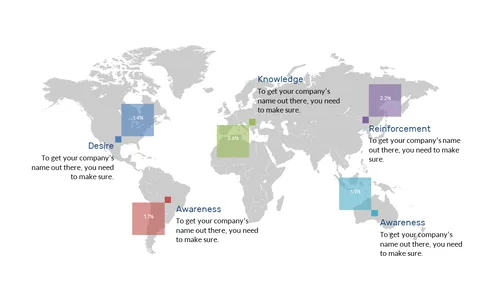
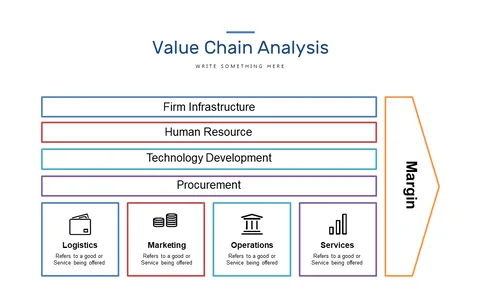
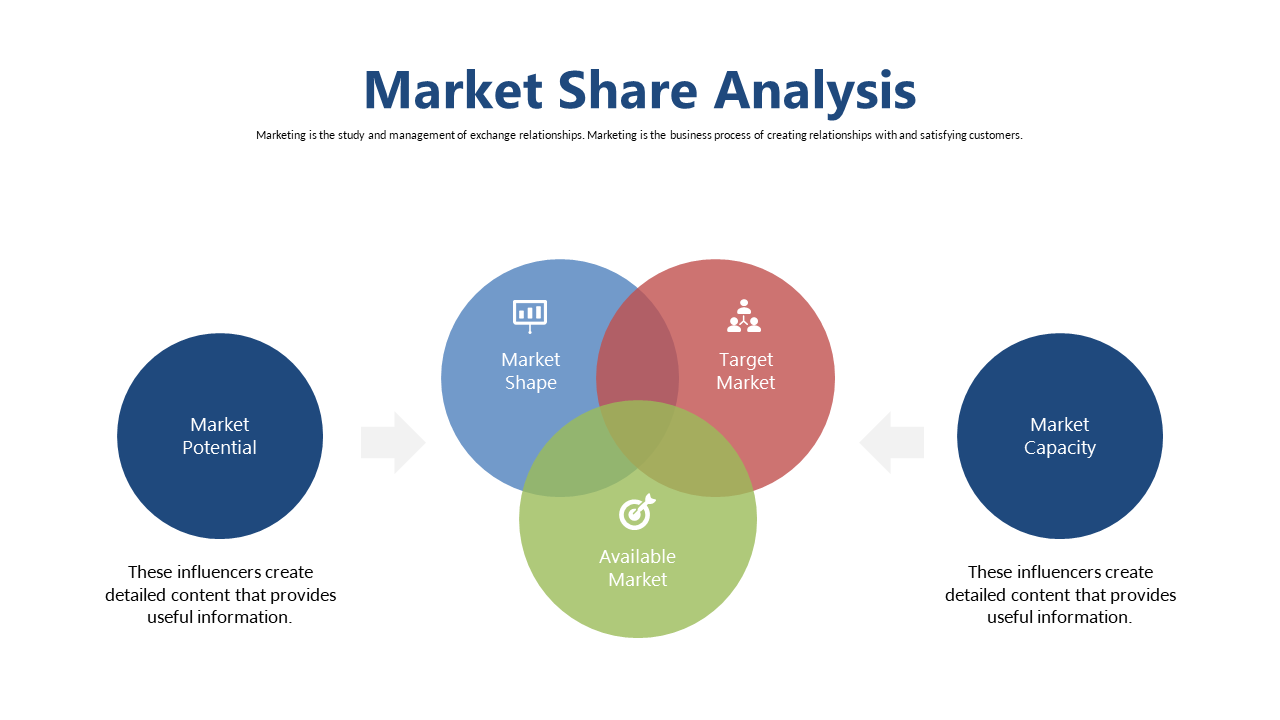
Understanding the intricate relationships between various market factors can be a challenge, especially when trying to keep your audience engaged. This Venn diagram slide effectively visualizes market dynamics, enabling you to illustrate overlapping concepts and relationships clearly.
Market researchers, business analysts, and consultants will find this slide invaluable during strategy meetings or analytical presentations. By using this engaging design, you can connect the dots between market trends, customer behaviors, and competitive activities, making your case more compelling.
For just $0.99, you can easily download this slide, which is fully customizable in both PowerPoint and Google Slides. This means you can adapt it quickly to suit your specific data and insights, all ready to impress in minutes.
$0.99 – Purchase Checkout
Added to cart