Visualize Market Data with Share Analysis Map
Product Description
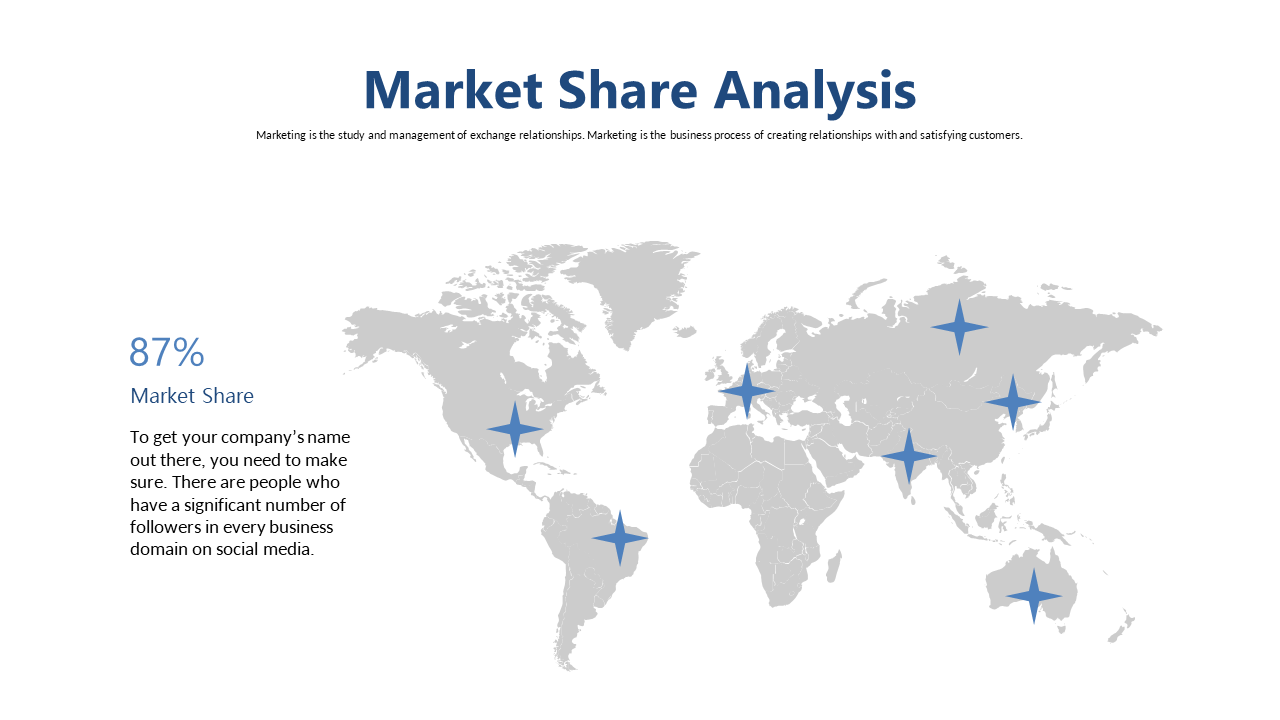
Capturing market data in a way that your audience can easily understand is no small feat. Strategy consultants often face the challenge of presenting dense information without losing engagement, especially when trying to highlight critical market trends. This share analysis map gives you the tools to make complex data visually appealing and accessible.
Whether you’re a market researcher preparing for a client meeting or a business analyst presenting quarterly data to your team, this slide fits perfectly. Imagine walking your audience through a global market landscape, pinpointing areas of interest and growth potential in real time.
It’s an essential visual for anyone looking to make data-driven decisions. At just $0.99, this slide is ready for instant download and easy to edit in PowerPoint or Google Slides. You’ll find that updating it with your specific data is a breeze, allowing you to focus on delivering your message effectively.
$0.99 – Purchase Checkout
Added to cart







