Visualize Factors with Fishbone Diagram Template
Product Description
Dealing with complex issues can often feel like searching for a needle in a haystack when you need to determine root causes. A Fishbone Diagram simplifies this process by visually categorizing contributing factors, making analysis much more efficient.
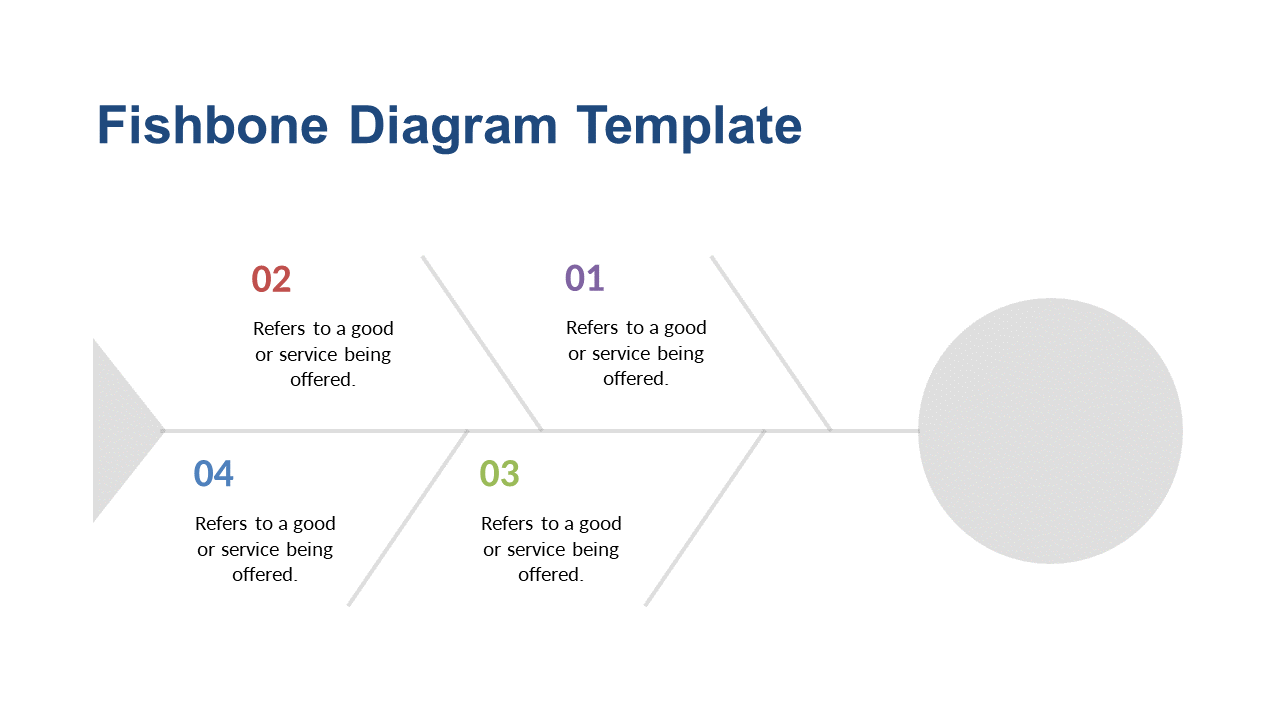
This slide provides a clear layout that organizes related issues for a better understanding of what’s at play. This slide is a great fit for project managers needing to clarify challenges in team meetings or risk assessment sessions. It can also be valuable for consultants working with clients to diagnose problems and recommend solutions based on the identified factors.
For only $0.99, you can download this slide instantly and have it ready for your needs. It’s fully editable in PowerPoint and Google Slides, allowing you to customize it with ease and add your insights quickly.
$0.99 – Purchase Checkout
Added to cart







