Explore Causes with Fishbone Diagram Template V2 3
Product Description
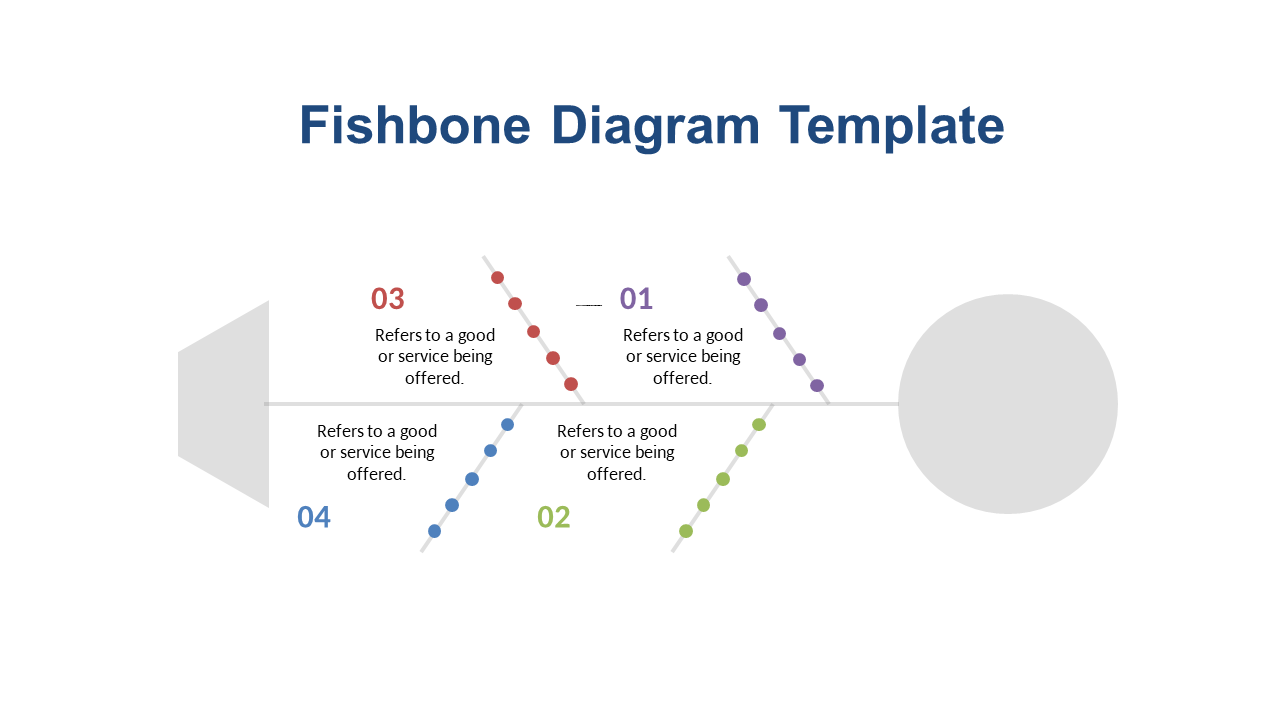
The challenge of breaking down complex issues into manageable components can leave anyone feeling stuck. Using a Fishbone Diagram slide can change that by allowing you to clearly visualize various contributing factors around a central problem.
This template makes it easy to present a structured analysis, empowering your team to grasp the situation at hand. This slide is ideal for business analysts conducting root cause analysis, project coordinators managing troubleshooting sessions, or consultants working through client challenges. Whether you’re in a healthcare environment assessing patient care issues or in IT resolving system outages, this template provides the clarity you need to drive discussions forward.
Available for only $0.99, this Fishbone Diagram template can be downloaded instantly and is fully editable in both PowerPoint and Google Slides. You can easily adjust the content to suit your context, making it ready for your next meeting in just a few minutes.
$0.99 – Purchase Checkout
Added to cart