Visualize Pricing Factors with Iceberg Diagram
Product Description
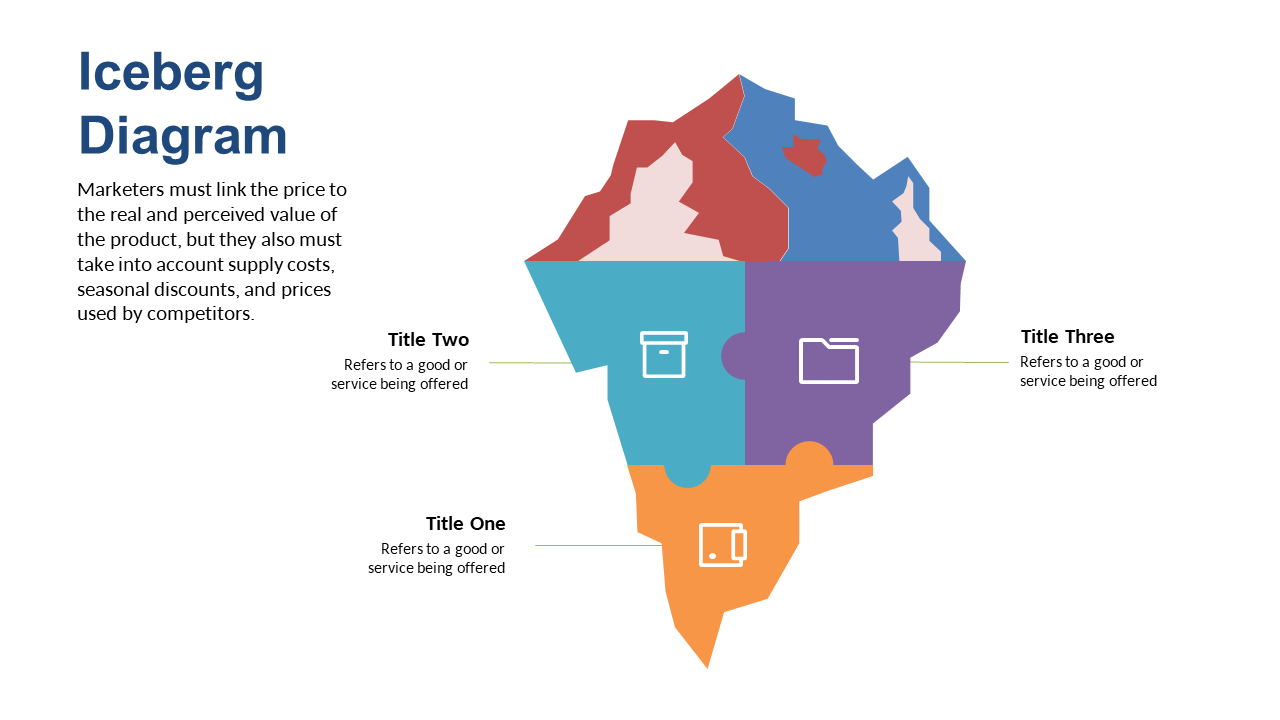
Navigating the complexities of pricing can leave both you and your audience feeling overwhelmed. This beautifully designed iceberg diagram illustrates the visible and hidden factors that influence product pricing, making it straightforward to convey essential insights.
You’ll find it easier to lead conversations and drive understanding with this visual aid. This slide is ideal for finance professionals, product managers, or sales directors who are preparing pricing strategy meetings, budget proposals, or market analysis presentations. It helps clarify the nuances of pricing structures, ensuring your audience is on the same page.
For just $0.99, you can instantly download and customize this slide in PowerPoint or Google Slides. Editing it is simple, allowing you to be presentation-ready in no time.
$0.99 – Purchase Checkout
Added to cart







