Analyze Price Perception with Iceberg Diagram
Product Description
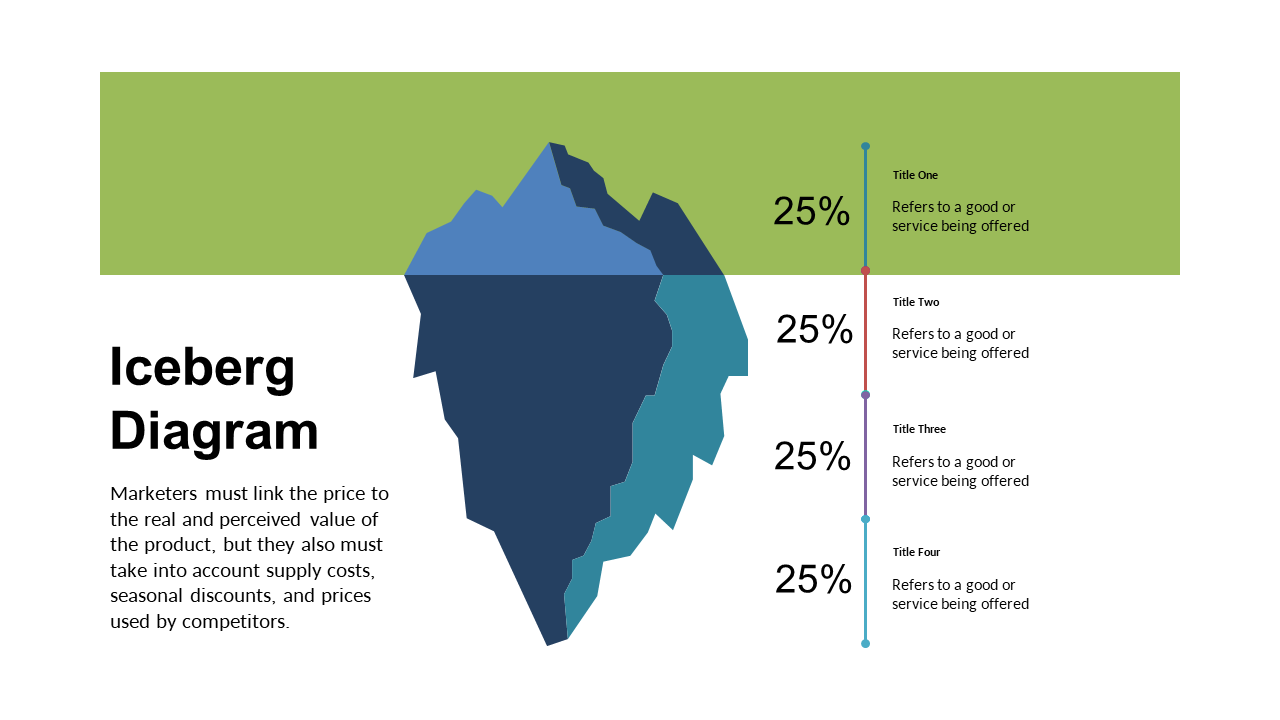
Many professionals struggle with understanding price perception and the complex factors that affect pricing strategies. The Iceberg Diagram visually reveals these elements, highlighting that much of the influence on pricing occurs below the surface and isn’t often discussed.
You’ll find this slide beneficial whether you’re a pricing analyst discussing models, a product manager presenting to executives, or a sales director explaining pricing strategies to your team. It’s particularly useful in strategy sessions where dissecting pricing perception can lead to better market positioning.
Download this slide for just $0.99, and you’ll have it in minutes. It’s easy to edit in PowerPoint and Google Slides, allowing you to personalize it quickly for your next presentation.
$0.99 – Purchase Checkout
Added to cart







