Gain Market Insights with Iceberg Diagram
Product Description
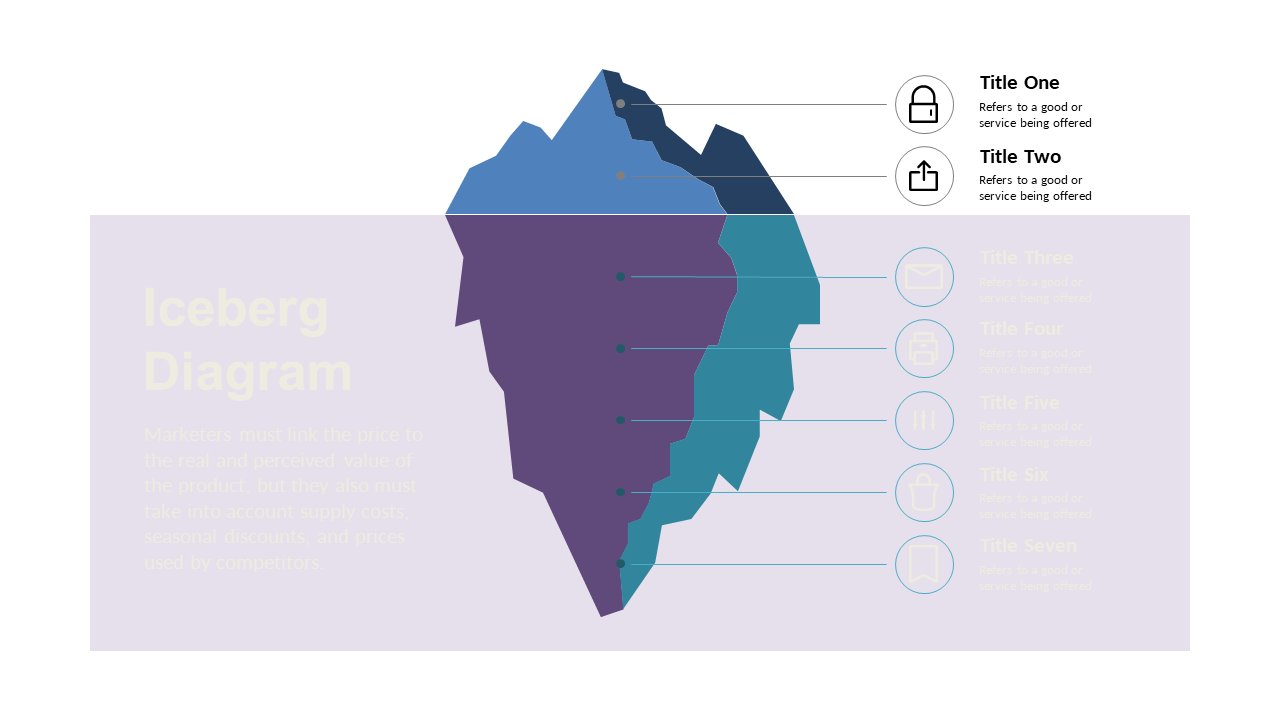
Navigating market dynamics can often feel overwhelming, especially when you want to highlight the underlying factors that drive product value. The Iceberg Diagram offers a clear and engaging way to break down these complexities, showing not just what is visible but what’s hidden beneath the surface as well.
Market researchers, product managers, and business strategists will find this slide invaluable while analyzing consumer behavior, preparing market analysis presentations, or conducting competitive research. It’s a great fit for team discussions where understanding market influences is key to making informed decisions.
For only $0.99, this slide is ready for immediate download and is fully editable in PowerPoint and Google Slides. You can adjust it quickly to match your branding and content, making your presentations effective in no time.
$0.99 – Purchase Checkout
Added to cart