Illustrate Market Value Dynamics with Iceberg Diagram
Product Description
Understanding how perceived and actual market value interact can be tricky, especially when trying to convey that to others. It’s important to visually express this dynamic without oversimplifying the data.
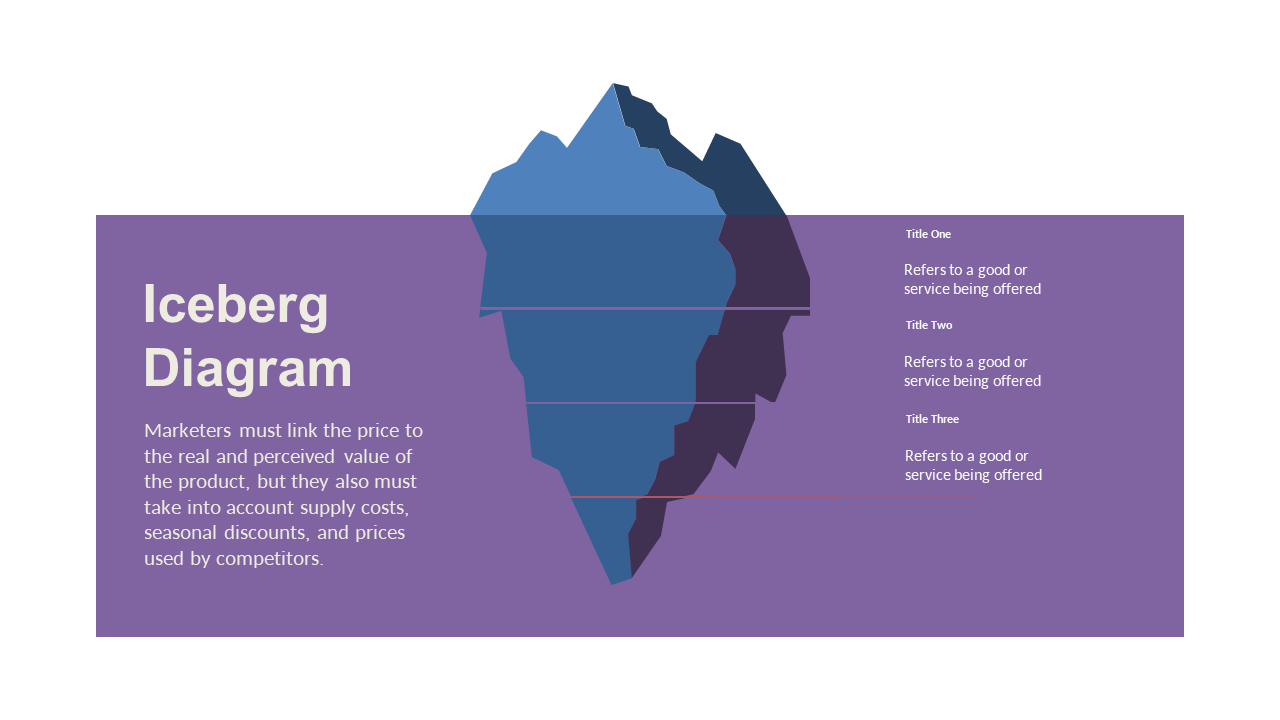
This Iceberg Diagram provides a clear illustration to represent the underlying complexities of market value. Marketing professionals, sales executives, and strategy consultants can make great use of this slide in various settings, from strategic planning sessions to sales training workshops. It helps in articulating the nuances of how customers view value, especially when discussing price adjustments or new product developments.
For only $0.99, you can download this slide right away, and it’s fully editable in PowerPoint and Google Slides. Get your presentation tailored in just a few minutes, allowing you to focus on your message rather than the design process.
$0.99 – Purchase Checkout
Added to cart







