Analyze Market Value vs. Perceived Value
Product Description
Making the difference between market value and perceived value clear to your audience can be a daunting task. Often, complex data can lead to misunderstandings, diluting your message.
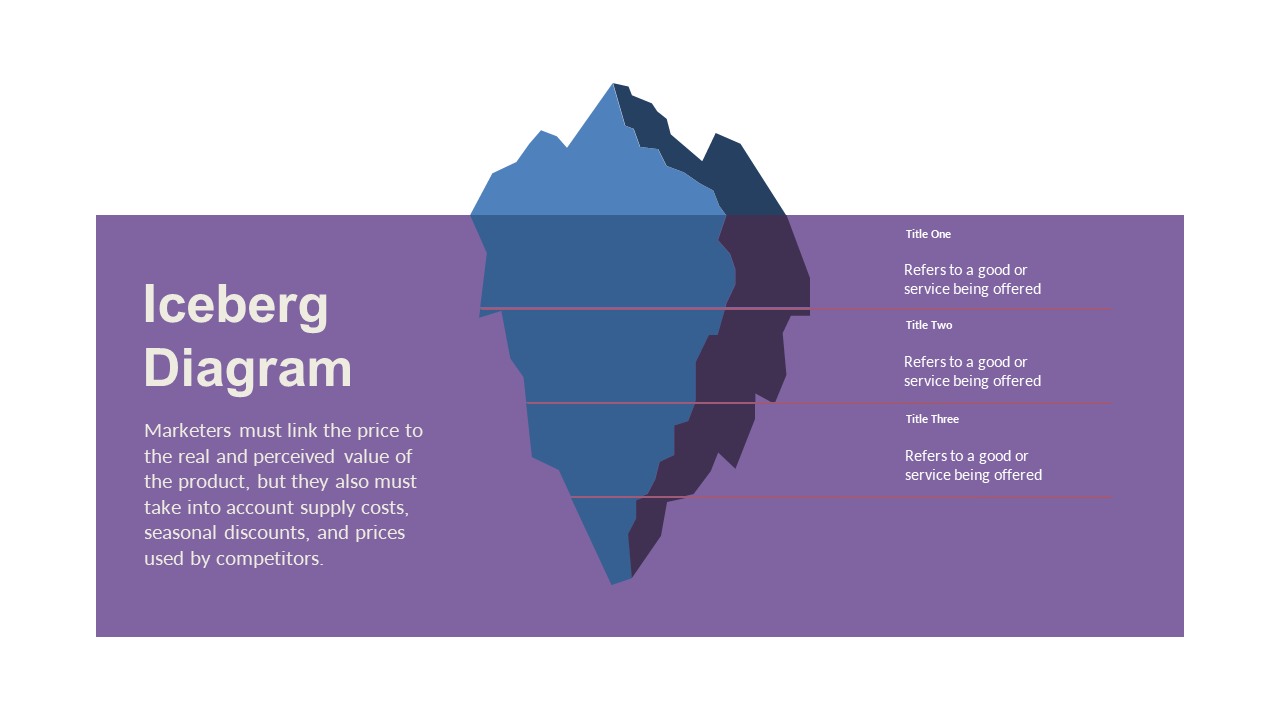
This Iceberg Diagram visually represents the relationship between these two concepts, helping to clarify that divide. This slide is particularly useful for marketing analysts, business development managers, and anyone involved in price strategy during team meetings or client presentations. It can be a key resource when you’re discussing market positioning or evaluating customer insights.
Available for just $0.99, this slide can be downloaded instantly and is easy to customize in both PowerPoint and Google Slides. You’ll have the ability to adapt it to your specific needs, making your presentation not just fast, but also impactful.
$0.99 – Purchase Checkout
Added to cart







