Represent Value Dynamics with Iceberg Diagram
Product Description
Convincing your audience of the intricacies of product value can be tough when the details are complex. You need a way to show the difference between perceived and actual value clearly.
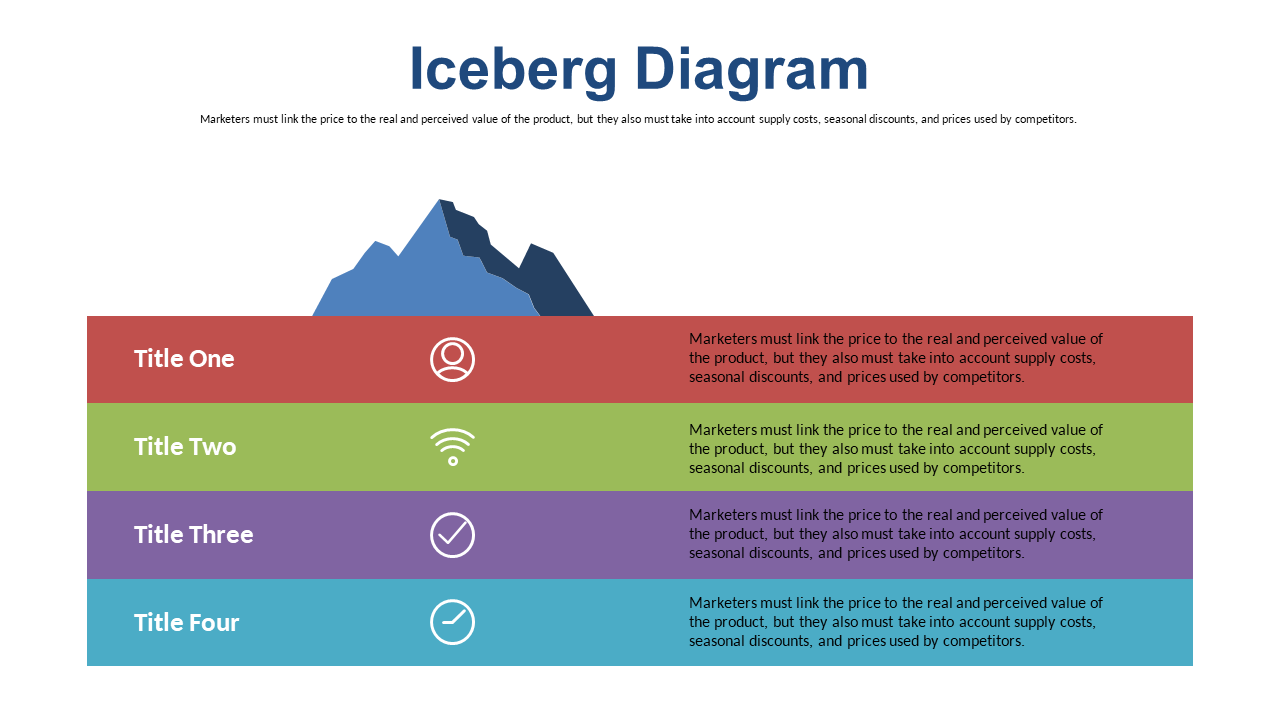
This Iceberg Diagram provides a straightforward visual that makes those complexities easy to understand. Product managers, pricing strategists, and marketing professionals can use this slide in various contexts, such as product evaluations, pricing strategy discussions, or competitive analyses. Situations where you need to communicate how perception impacts sales and customer loyalty are perfect for this diagram.
For just $0.99, you can download this slide instantly, and it’s ready for editing in PowerPoint and Google Slides. With just a few tweaks, you can present a professional-looking graphic that conveys your message effectively.
$0.99 – Purchase Checkout
Added to cart







