Explore Value Perception with Iceberg Diagram
Product Description
Understanding the gap between actual product benefits and customer perceptions can be a frustrating challenge for marketers. You might find yourself unsure of how to visually represent this complex relationship, leaving your audience confused rather than informed.
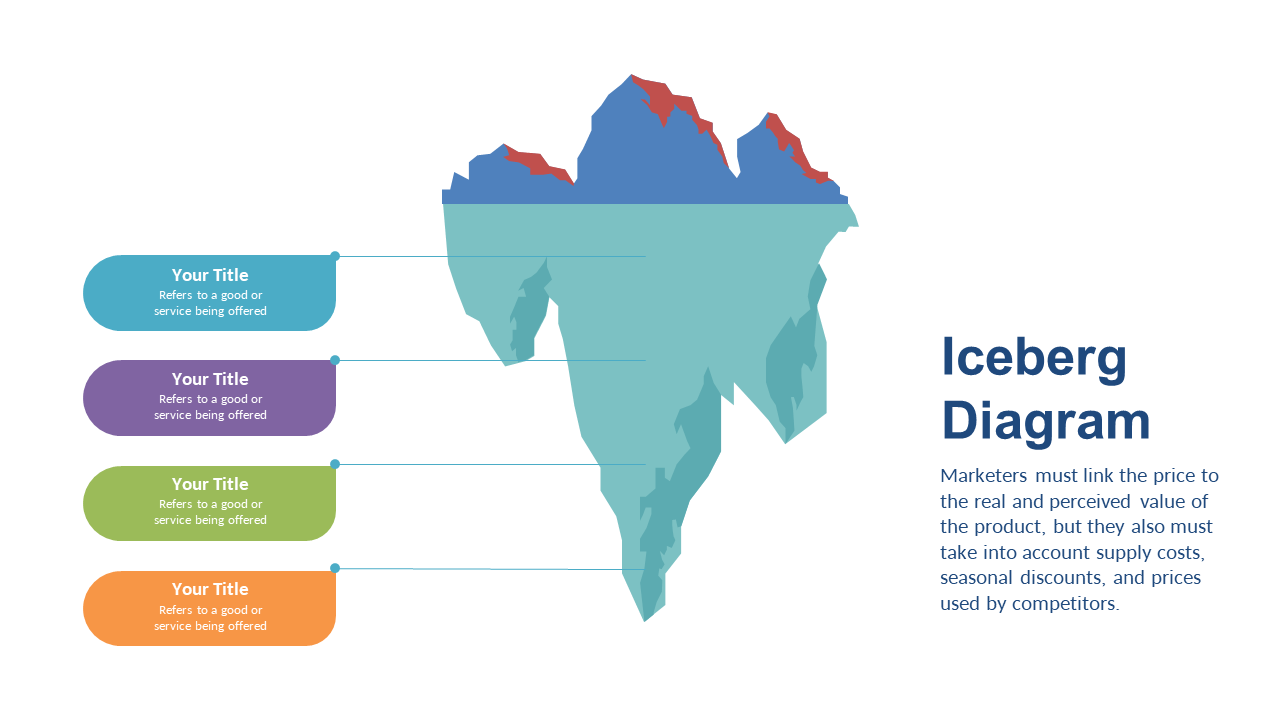
This Iceberg Diagram helps you communicate the nuanced differences in an engaging way. Marketing managers, product strategists, and brand analysts will find this slide especially useful during strategy discussions or presentations about customer insights. It’s perfect for meetings where you need to clarify how consumers view your product versus what it genuinely offers, making it ideal for product launches or value proposition workshops.
For just $0.99, this slide is available for instant download and easy editing in PowerPoint and Google Slides. You’ll be able to customize it to fit your specific needs and have a polished presentation ready in minutes.
$0.99 – Purchase Checkout
Added to cart







