Assess Product Value vs. Cost with Iceberg Diagram
Product Description
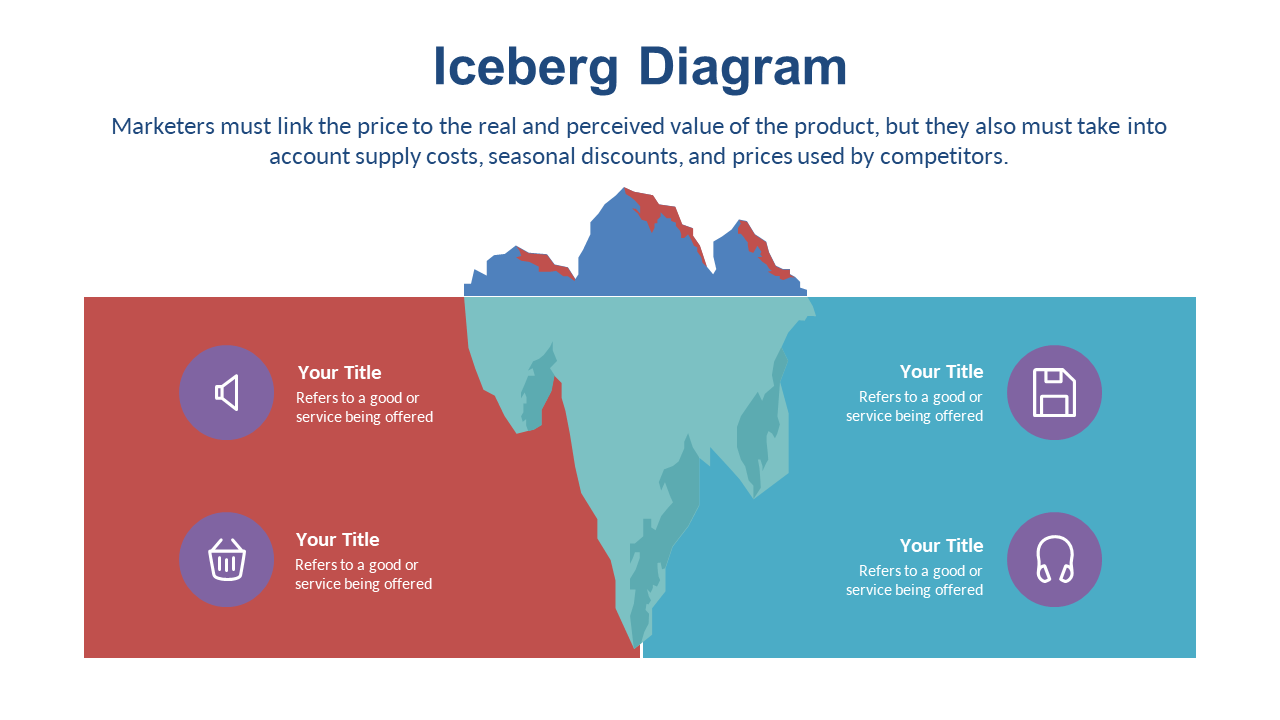
Grasping the dynamic between perceived value and actual cost can often feel overwhelming. The Iceberg Diagram simplifies this concept, offering a visual that distinguishes between what is visible and what lies beneath the surface, ultimately making it easier for your audience to understand pricing strategies.
This slide is perfect for marketing analysts, finance professionals, and product development teams during presentations on pricing tactics or during workshops focused on value communication. It helps bring clarity to discussions about how value is perceived by customers versus actual financial metrics.
You can download this slide for just $0.99, and it’s fully editable in PowerPoint and Google Slides. Personalize it effortlessly and prepare to captivate your audience in minutes.
$0.99 – Purchase Checkout
Added to cart







