Illustrate Market Value with Iceberg Diagram
Product Description
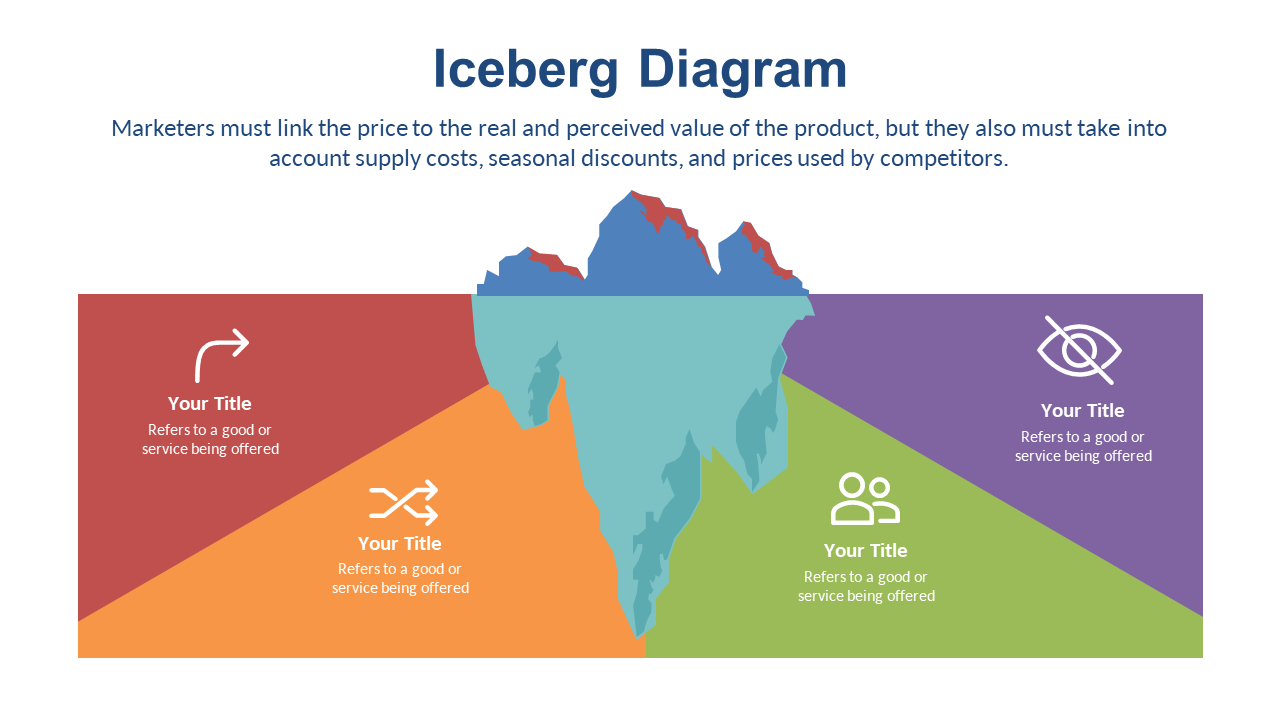
Understanding market value often involves untangling a web of complexities that can confuse even the most seasoned professionals. This Iceberg Diagram visually separates perceived value from actual value, making it easier for you to effectively communicate these differences to your audience.
This slide is particularly useful for market researchers and business developers during presentations or client meetings where clear value communication is essential. It helps to clarify complex ideas about market value, fostering better understanding among team members and clients alike.
For just $0.99, you get immediate access to this slide, which is fully editable in PowerPoint and Google Slides. You’ll be able to customize it quickly, ensuring you can enhance your presentations without hassle.
$0.99 – Purchase Checkout
Added to cart







