Assess Value Propositions with Quadrant Diagram
Product Description
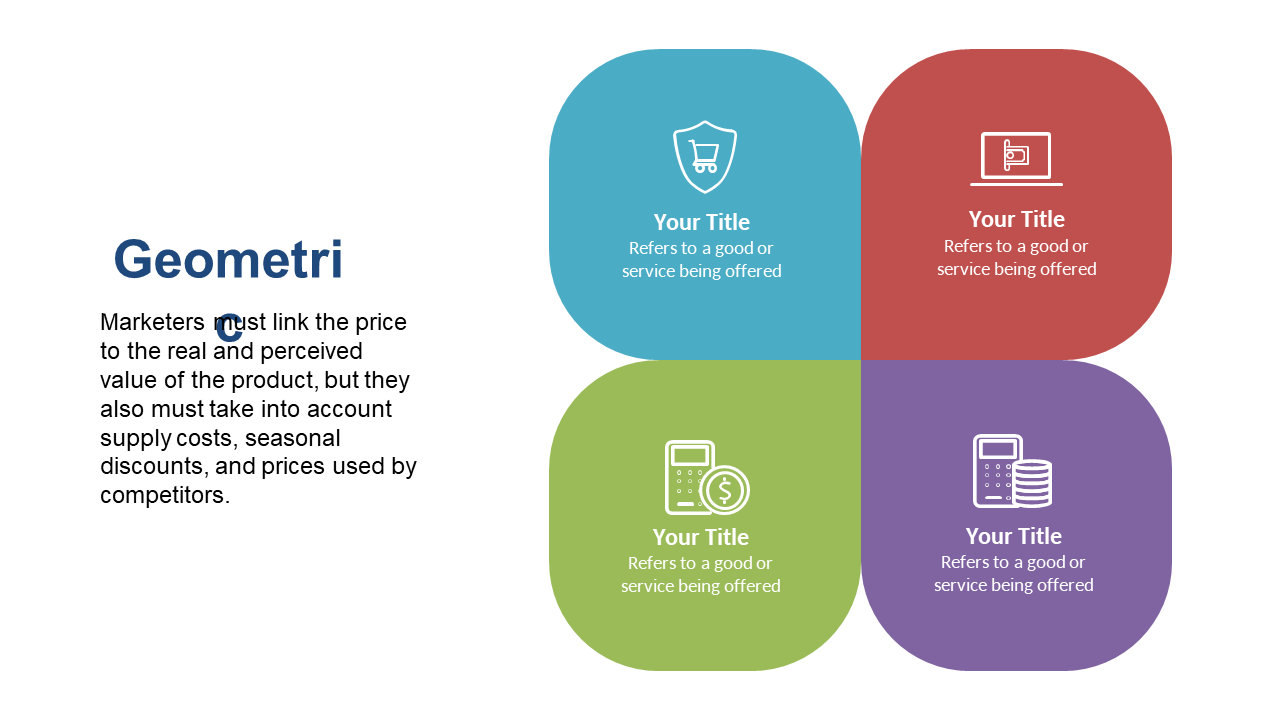
Understanding where your value proposition fits in a competitive landscape can be challenging, especially when trying to convey that information effectively. This quadrant diagram breaks down key factors like price and competition, making it easier for you to visualize your offerings’ strengths and weaknesses. You’ll gain clarity and confidence in your assessments, which is crucial for strategic planning.
Perfect for marketers, business analysts, and product managers, this slide is invaluable during product evaluations, strategy discussions, or competitive analysis presentations. You can clearly show your product’s positioning, helping to drive important business decisions.
Picture the impact of presenting a well-structured analysis that clearly defines how your offerings stack up against the competition. At just $0.99, this slide is an instant download and can be easily edited in PowerPoint and Google Slides. Take the complexity out of your presentations and get your analysis ready in just minutes.
$0.99 – Purchase Checkout
Added to cart







