Venn Diagram for Pricing Analysis
Product Description
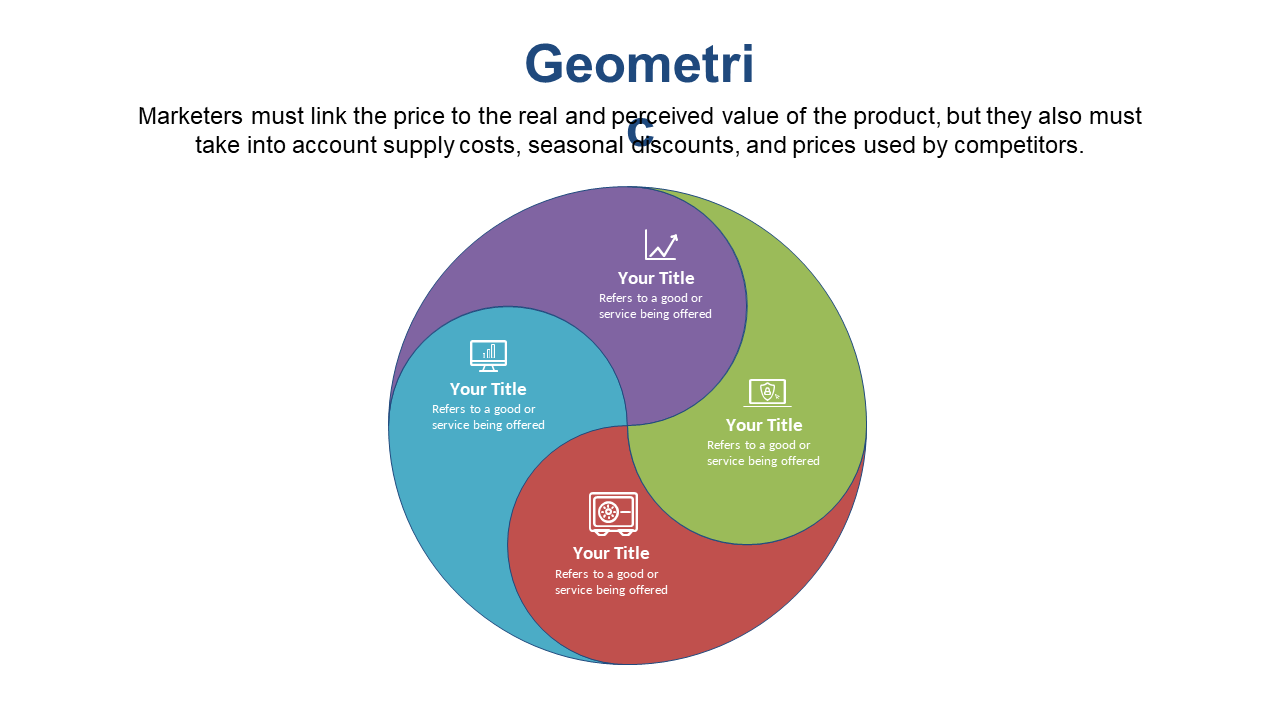
Understanding the delicate balance between real value and perceived value can be a daunting task, especially when analyzing competitor pricing. With this Venn Diagram for Pricing Analysis, you can present these complex relationships in a way that’s both visually appealing and easy to digest for your audience.
Market researchers, product managers, and pricing analysts will find this slide particularly useful when discussing pricing strategies with team members or during client presentations. Whether you’re evaluating new product pricing for a tech startup or analyzing pricing models in a retail context, this diagram helps clarify your points.
For just $0.99, you can download this slide instantly and edit it in PowerPoint or Google Slides. It’s ready to go in just minutes, allowing you to focus on crafting your message rather than worrying about design.
$0.99 – Purchase Checkout
Added to cart