Gantt Chart for Task Management and Analysis
Product Description
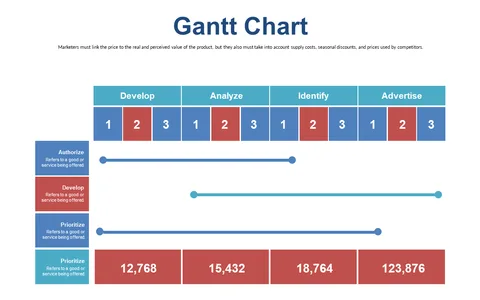
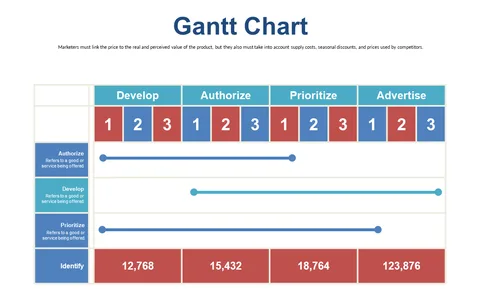
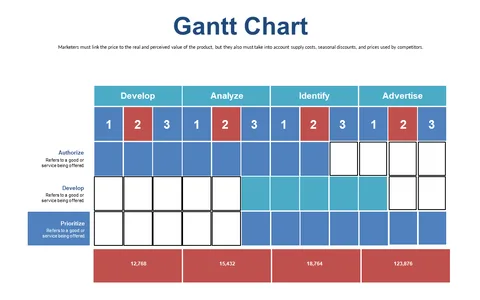
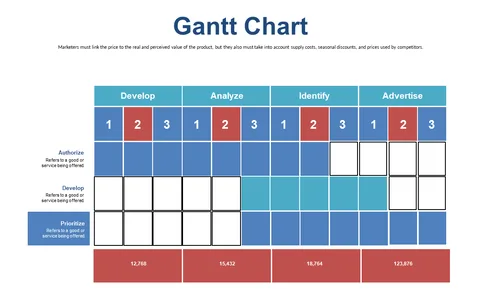
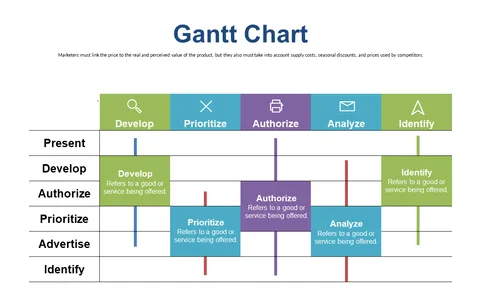
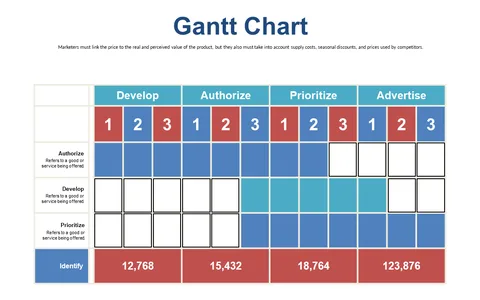
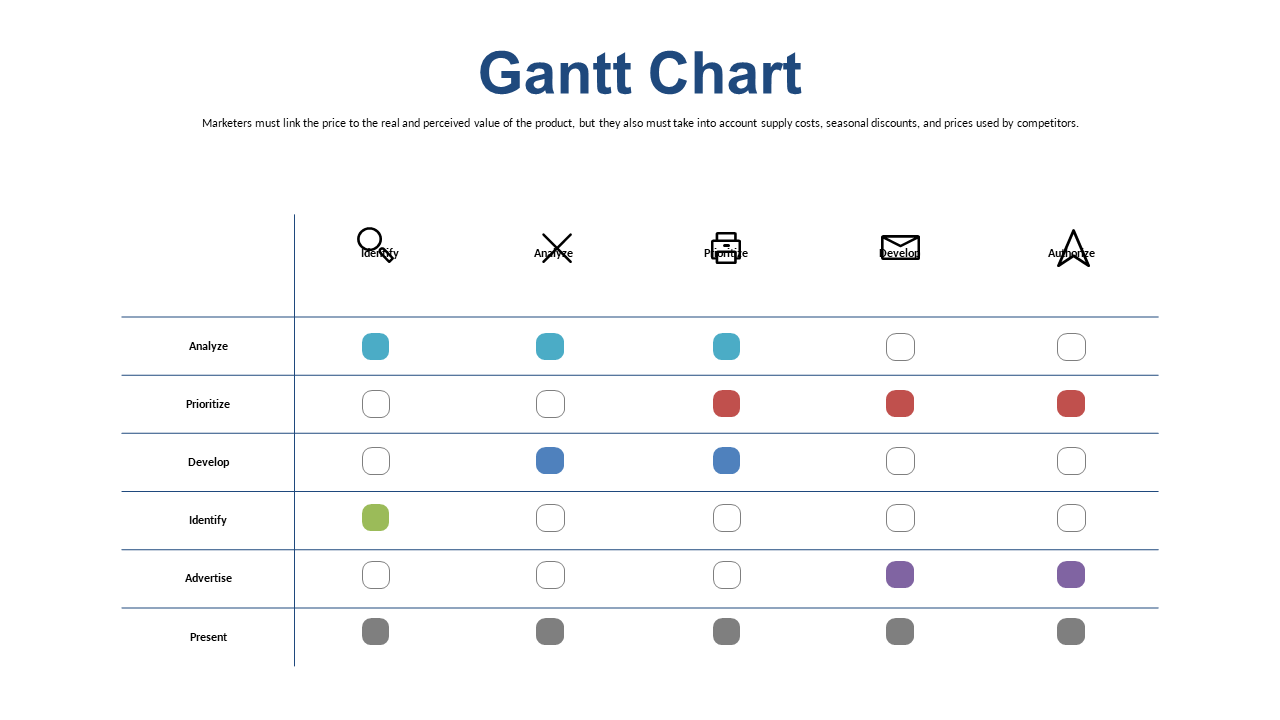
Shifting priorities can complicate task management, leaving teams uncertain about timelines and allocations. You need a clear visual tool to help everyone stay aligned, and this Gantt chart slide delivers just that.
It organizes tasks visually, helping you keep track of progress while also analyzing where your resources are going. This slide works wonders for operations managers, project coordinators, and marketing teams who need a clear overview of their work. Use it in project kick-offs or weekly updates to illustrate how each task interrelates and what adjustments are needed in real time.
For just $0.99, you can download this easy-to-edit Gantt chart, compatible with both PowerPoint and Google Slides. It’s simple to customize, ensuring you can quickly adapt it to your current projects and start using it right away.
$0.99 – Purchase Checkout
Added to cart