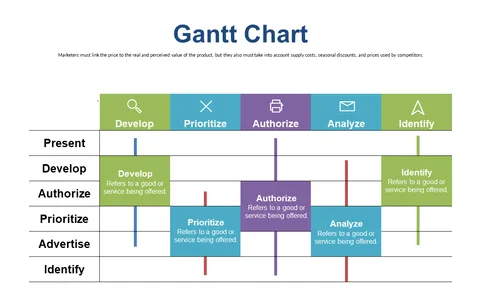
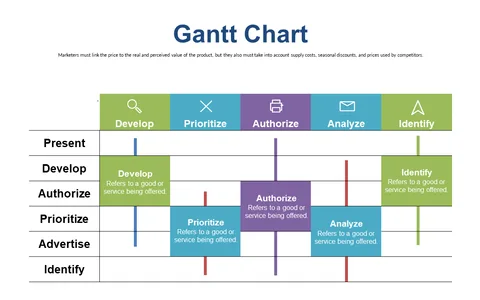
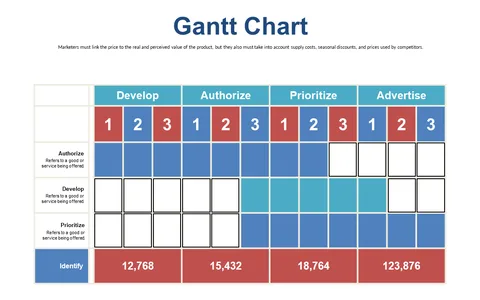
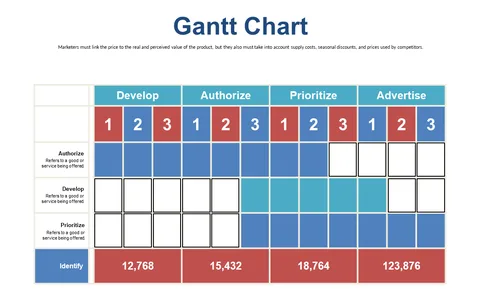
Gantt Chart for Marketing Price Analysis
Product Description
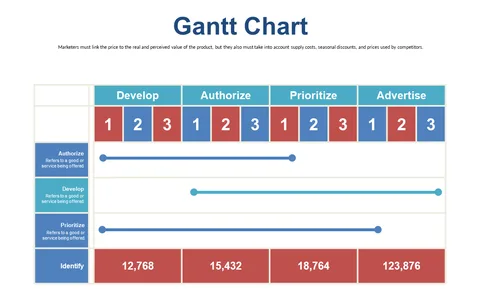
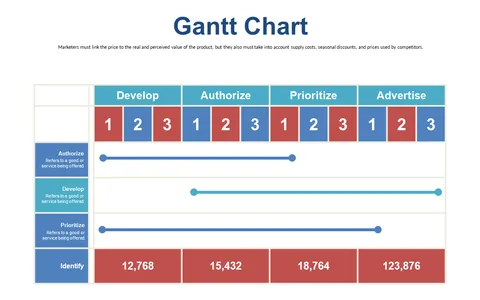
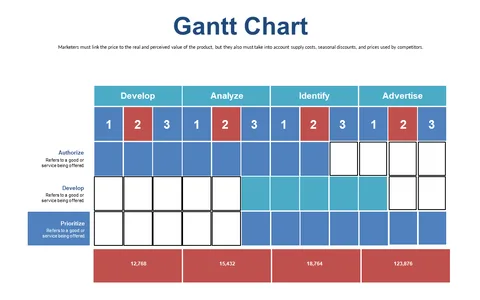
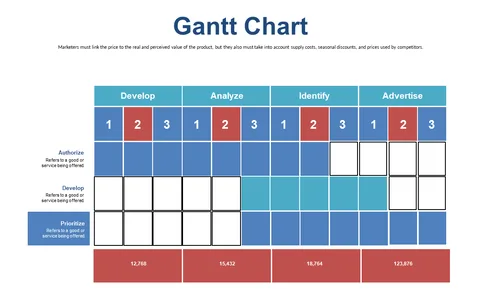
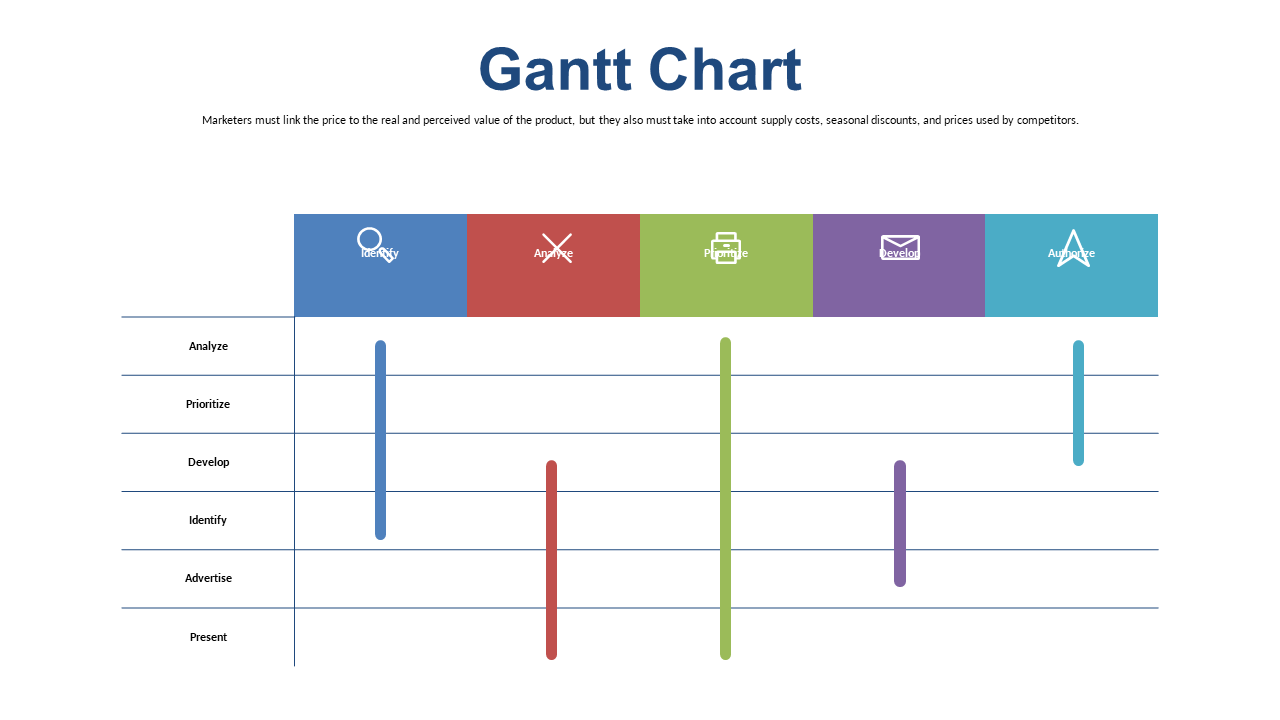
Analyzing pricing strategies can be daunting when project timelines are scattered and unclear. Keeping track of your progress and dependencies shouldn’t add to your stress, and this Gantt chart slide is designed to alleviate that challenge.
It allows you to see everything at a glance, making it easier to communicate updates and avoid confusion. You’ll find this slide especially useful if you work in marketing analytics, pricing strategy, or project management roles. It’s ideal for pricing analysts looking for a visual way to present their findings in meetings, helping everyone stay on the same page during discussions about pricing adjustments or campaign timelines.
At just $0.99, this Gantt chart is ready for instant download, and it’s super easy to edit in PowerPoint or Google Slides. Customize it with your project details in no time and start presenting your analysis effectively.
$0.99 – Purchase Checkout
Added to cart