Gantt Chart for Project Phases and Milestones

Product Description
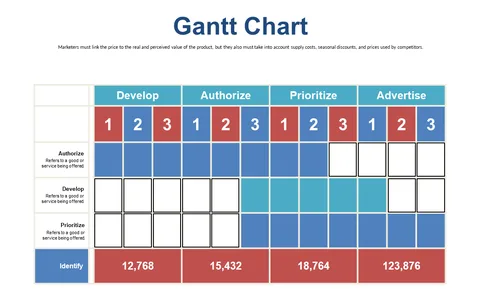
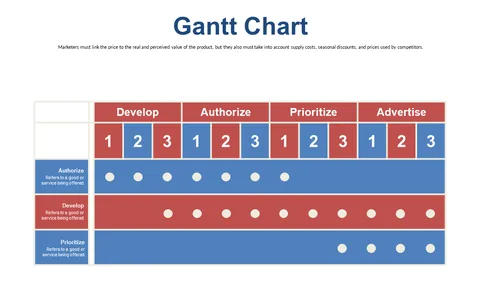
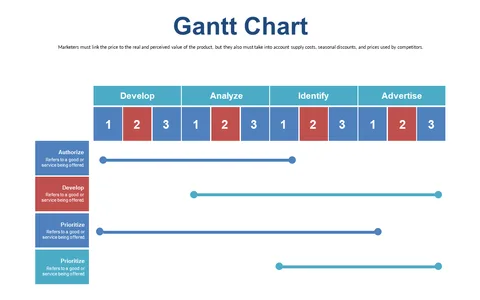
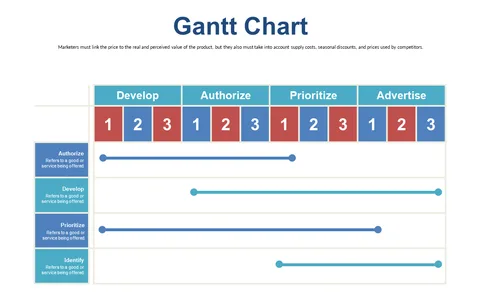
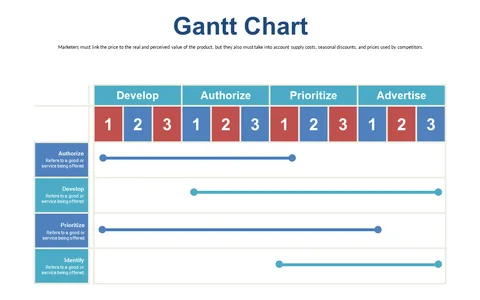
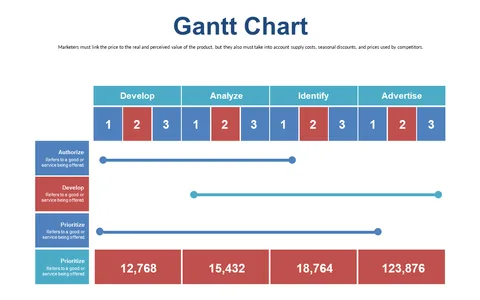
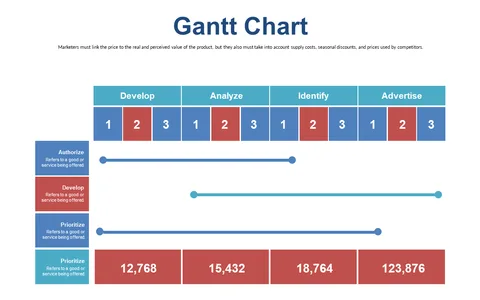
Navigating project phases and milestones can quickly turn confusing without a clear visual guide. This Gantt Chart slide is designed to simplify that complexity, providing an intuitive way to showcase your project timeline and essential tasks. With this slide, you can eliminate miscommunication and keep your team focused on priorities.
Business analysts and product managers in tech startups will find this slide particularly helpful during sprint planning and project reviews. It’s also ideal for marketing teams when discussing campaign timelines and deliverables, ensuring everyone knows what to expect and when.
For just $0.99, this Gantt Chart slide is available for instant download. It’s fully editable in PowerPoint and Google Slides, so
you can customize it to fit your project’s unique phases in no time.
$0.99 – Purchase Checkout
Added to cart