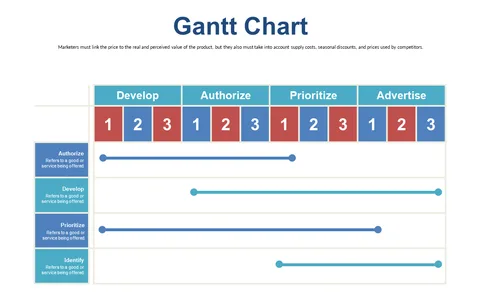
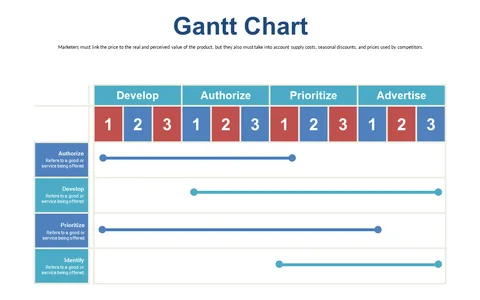
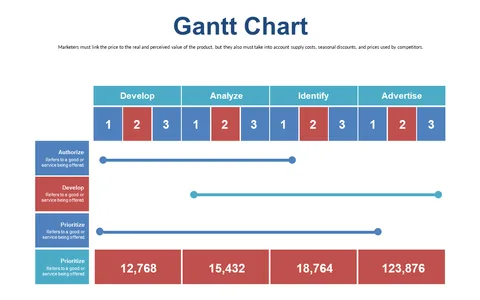
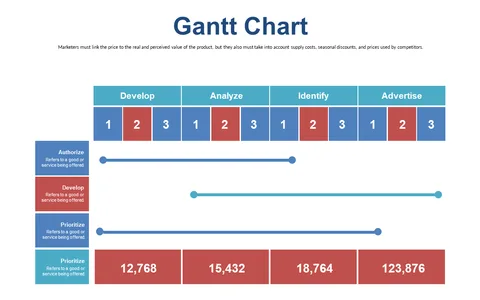
Track Project Phases with Editable Gantt Chart
Product Description
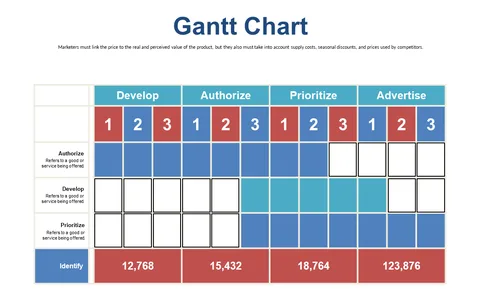
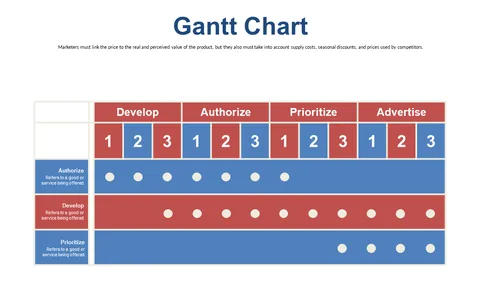
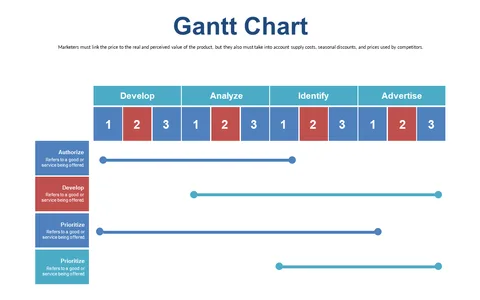
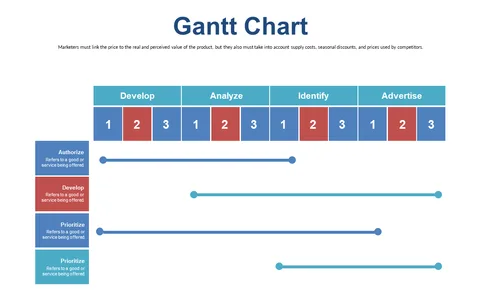
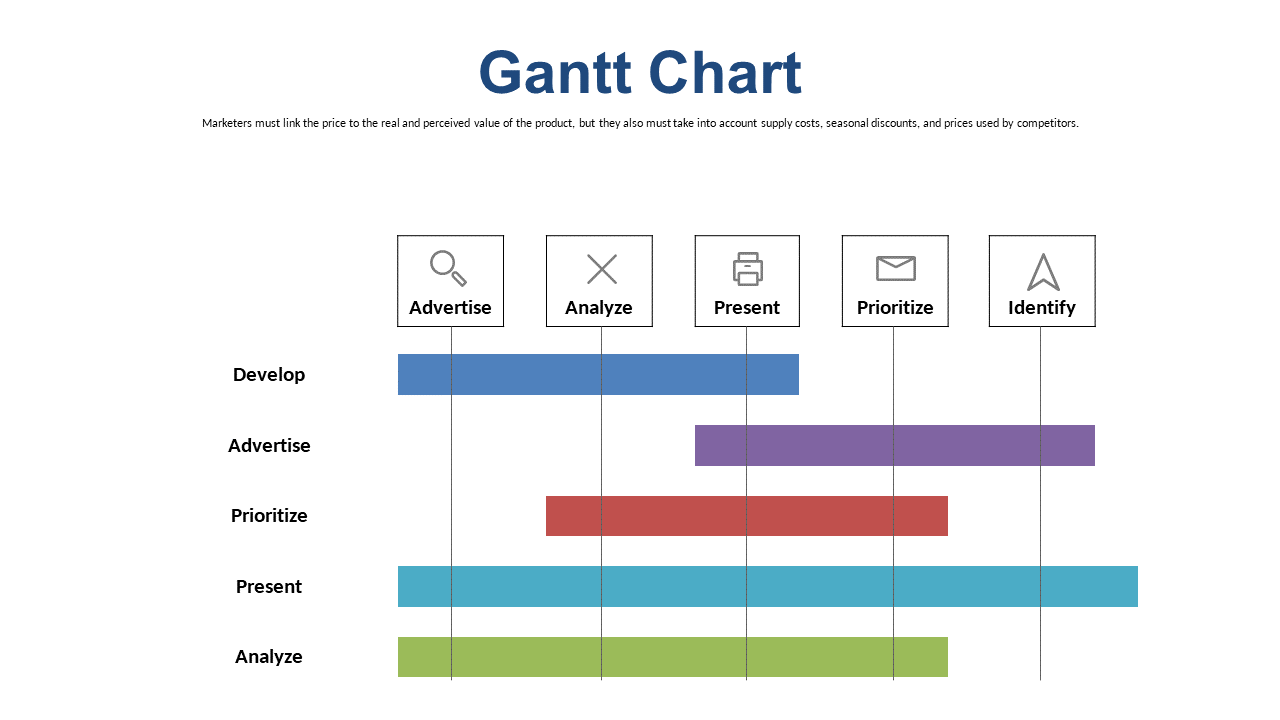
Trying to manage multiple phases of a project can lead to chaos, especially when deadlines are looming. You need a straightforward way to organize and communicate timelines without diving into a sea of data. This editable Gantt chart slide simplifies complex project details into a clear visual format that everyone can understand.
This slide is perfect for project coordinators in industries like construction or IT, particularly during kickoff meetings or quarterly project reviews. If you’re a product manager or operations lead juggling various project timelines, this tool will help you present your plans with clarity.
Presenting updates to a team or executives becomes hassle-free when you can visually track progress against deadlines. For just $0.99, you can instantly download this slide and start editing it in PowerPoint or Google Slides. Customize the timeline to fit your project needs within minutes and enhance your next presentation with ease.
$0.99 – Purchase Checkout
Added to cart