Visualize Customer Journey from Awareness to Loyalty

Product Description
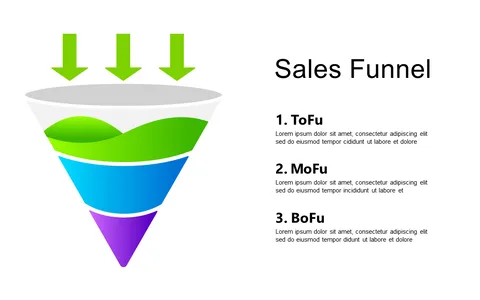
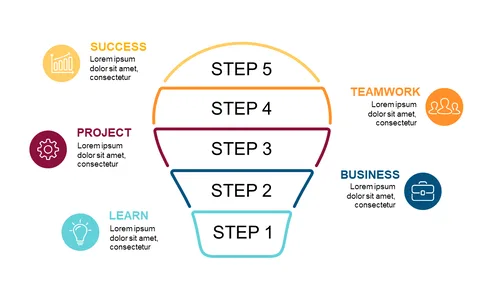
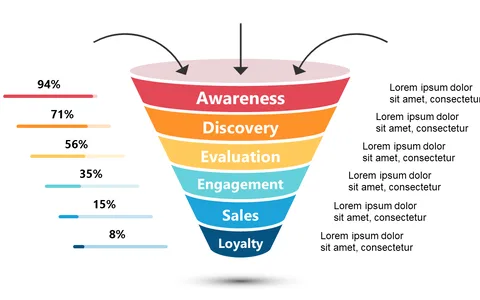
In the fast-paced world of sales and marketing, articulating the journey from awareness to loyalty can be a significant hurdle. This slide addresses that pain point by offering a visually engaging funnel infographic that neatly breaks down each stage of customer progression, making it easier for audiences to absorb the information.
Sales managers, marketing specialists, and business development professionals will appreciate how this slide enhances their presentations during client meetings, product launches, or marketing strategy sessions. It provides a clear visual guide that can help clarify your narrative, making it relatable and memorable for your audience.
Available for only $0.99, this slide is an instant download that
you can easily customize in both PowerPoint and Google Slides. Make your presentations more impactful in just minutes with this user-friendly tool at your fingertips.
$0.99 – Purchase Checkout
Added to cart